INTRODUCTION
Recently, due to excessive intake of food and drink coupled with physical inactivity, the prevalence of obesity has been increasing in the world. As of 2011, 400 million people globally were obese. In the United States, the number of obese individuals rose to 13.4% in 1960, 30.9% in 2000, and 33.8% in 2007.1) In Korea, by 1998 and 2007, the proportions of obesity had increased to 26.0% and 31.7%, respectively.2) Obesity is widely recognized as an important risk factor for type 2 diabetes, hypertension, dyslipidemia, cardiovascular disease, non-alcoholic steatosis, sleep apnea, musculoskeletal disease, and malignant tumor.3-8) Notwithstanding, the medical literature has identified a unique subset of obese individuals who appear to be either protected or more resistant to development of the metabolic abnormalities associated with obesity. These individuals, now known as metabolically healthy but obese or benignly obese, despite carrying excessive body fat, display a favorable metabolic profile characterized by high levels of insulin sensitivity, lack of hypertension as well as normal lipid, inflammation, and hepatic profiles, which might explain their low incidences of type 2 diabetes and cardiovascular disease.5) The reported prevalence of metabolically healthy but obese (MHO) among obese individuals is 30% to 40%. Within this range there is variation according to different criteria.5,9) In fact, many variables, including waist circumference, fasting glucose, triglyceride, high density lipoprotein cholesterol (HDL-C), low density lipoprotein cholesterol (LDL-C), insulin sensitivity, homeostasis model assessment (HOMA), and high-sensitivity C-reactive protein (hsCRP) have been used to identify MHO; however, standardization, clearly, has not yet been achieved. Among 5,267 Korean individuals, the National Cholesterol Education Program Adult Treatment Panel III (NCEP ATP III) criteria indicate that 15.2% of the 47.9% who are obese are MHO.10) Comparisons of the prevalence defined by the various criteria have not yet been reported among Koreans.
The purpose of this study was to compare the prevalence, demographic and metabolic characteristics of MHO middle-aged men according to different criteria.
METHODS
1. Subjects
The study sample consisted of 330 obese individuals whose body mass index (BMI) was more than 25 kg/m2. They were selected from among 1,098 individuals for whom insulin, lipid profile, and apolipoprotein measurements had been taken in 2010 at the Dankook University Hospital Health Promotion Center. None of the participants had any history or showed any evidence of the following: 1) triglyceride > 400 mg/dL, 2) hypertension, 3) diabetes, 4) cardiovascular disease, 5) thyroid disease, 6) osteoporosis, or 7) cerebral infarction. As the number of women was too small, women were also excluded. The final sample consisted of 186 men.
2. Body Composition and Blood Samples
Height, weight, and body fat percentage were measured using body composition analysis and bioelectrical impedence analysis including ultrasound height measurement (Inbody 720; Biospace, Seoul, Korea). Waist circumference was measured with flexible metric tape at a point midway between the lowest rib and the iliac crest, in the expiratory state. Preparatory to the measurement of blood pressure (BP), the subjects were asked to test for 5 minutes while seated, after which the measurement was recorded on an automatic BP monitor (EASY X 800; Jawon, Gyeongsan, Korea). Blood samples were collected after the subjects had fasted for at least 10 hours. Total cholesterol, triglyceride, HDL-C, LDL-C, aspartate aminotransferase (AST), alanine aminotransferase (ALT), gamma-glutamyl transpeptidase (╬│-GT), alkaline phosphatase (ALP), apolipoprotein A1, apolipoprotein B, and lipoprotein A were measured by immunoturbidimetric assay and an autoanalyzer (Modular DP; Hitachi, Tokyo, Japan). hsCRP was measured using the turbidimetric method (BN II Nephelometry, Siemens, St. Paul, MN, USA); hemoglobin A1c (HbA1c) was measured by high-performance liquid chromatography using the HbA1c kit (Bio Rad, Richmond, CA, USA); serum insulin was measured by immunoradiometric assay and a gamma counter (Gamma-10; Shinjin Medics, Seoul, Korea). Alcohol consumption was categorized by the criteria "nondrinker," representing those who reported consuming less than one drink per month, or "drinker," those who reported consuming more than one drink per month. Smoking was categorized as "nonsmoker," "former smoker," and "current smoker." Exercise was categorized as "no exercise," "irregular exercise," and "regular exercise." "Regular exercise" represented those who reported exercising more than once per week. As triglyceride (TG), HOMA, and hsCRP were not normally distributed, they were log10-transformed. Total cholesterol, HDL-C, and TG were used in the Friedwald formula to calculate LDL-C (total cholesterol-HDL-TG/5). The homeostasis Model Assessment of insulin resistance index (HOMA-IR) was calculated according to the following formula:
3. Criteria
The following criteria were used to determine MHO status: the NCEP ATP III criteria, 0-2 cardiometabolic abnormalities (BP Ōēź 130/85 mm Hg, waist circumference [WC] > 90 cm, triglyceride [TG] Ōēź 150 mg/dL, fasting plasma glucose [FPG] Ōēź 100 mg/dL, HDL-C < 40 mg/dL);10) the Wildman criteria, 0-1 cardiometabolic abnormalities (BP Ōēź 130/85 mm Hg, TG Ōēź 150 mg/dL, FPG Ōēź 100 mg/dL, HDL-C < 40 mg/dL, HOMA > 3.1 [90 percentile], hsCRP > 0.19 mg/L [90 percentile]);5) the Karelis criteria, 0-1 cardiometabolic abnormalities (HOMA Ōēź 2.7, TG Ōēź 150 mg/dL, HDL-C < 50 mg/dL, LDL-C Ōēź 100 mg/dL, hsCRP Ōēź 3 mg/L);5) the HOMA criteria (HOMA Ōēż 1.3 [lowest quartile]).11)
Subjects were classified as at-risk with Ōēź 3 cardiometabolic abnormalities by the NCEP criteria, with Ōēź 2 cardiometabolic abnormalities by the Wildman or Kaleris criteria, and with the upper quartiles in the HOMA index.
4. Statistical Analysis
Chi-square tests were performed to compare the prevalences of MHO according to the various criteria. Kappa statistics were compiled to compare the agreements among them. Because the median age was 35 years, the demographic and metabolic characteristics were compared between the MHO and at-risk groups, as defined by various criteria and dividing the overall subject population into two age groups (35 years or younger; older than 35 years). A t-test and chi-square test were performed to compare them. Because of the small sample size, the Mann-Whitney test was conducted for a HOMA criteria comparison. A statistical analysis using SPSS ver. 18.0 (SPSS Inc., Chicago, IL, USA) was also performed; the significance level was set at P < 0.05.
RESULTS
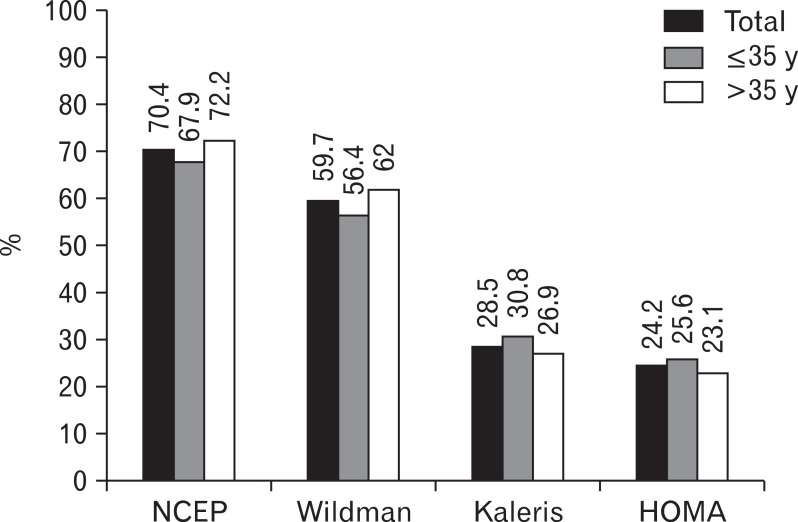
The mean age was 37.2 ┬▒ 6.2 years. The MHO prevalences were 70.4% according to the NCEP criteria, 59.7% for the Wildman criteria, 28.5% for the Kaleris criteria, and 24.2% for the HOMA criteria. The prevalences between the two age groups did not significantly differ (Figure 1).
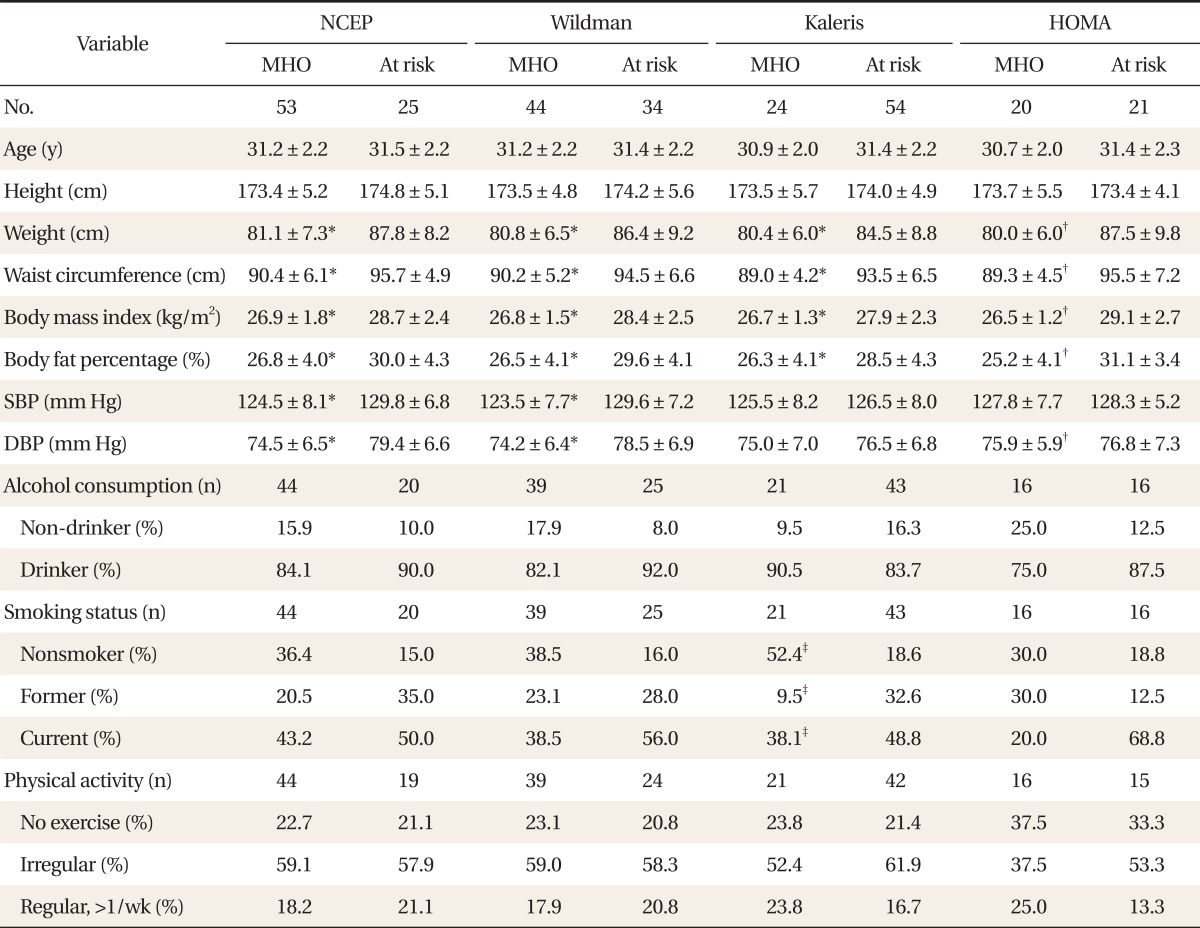
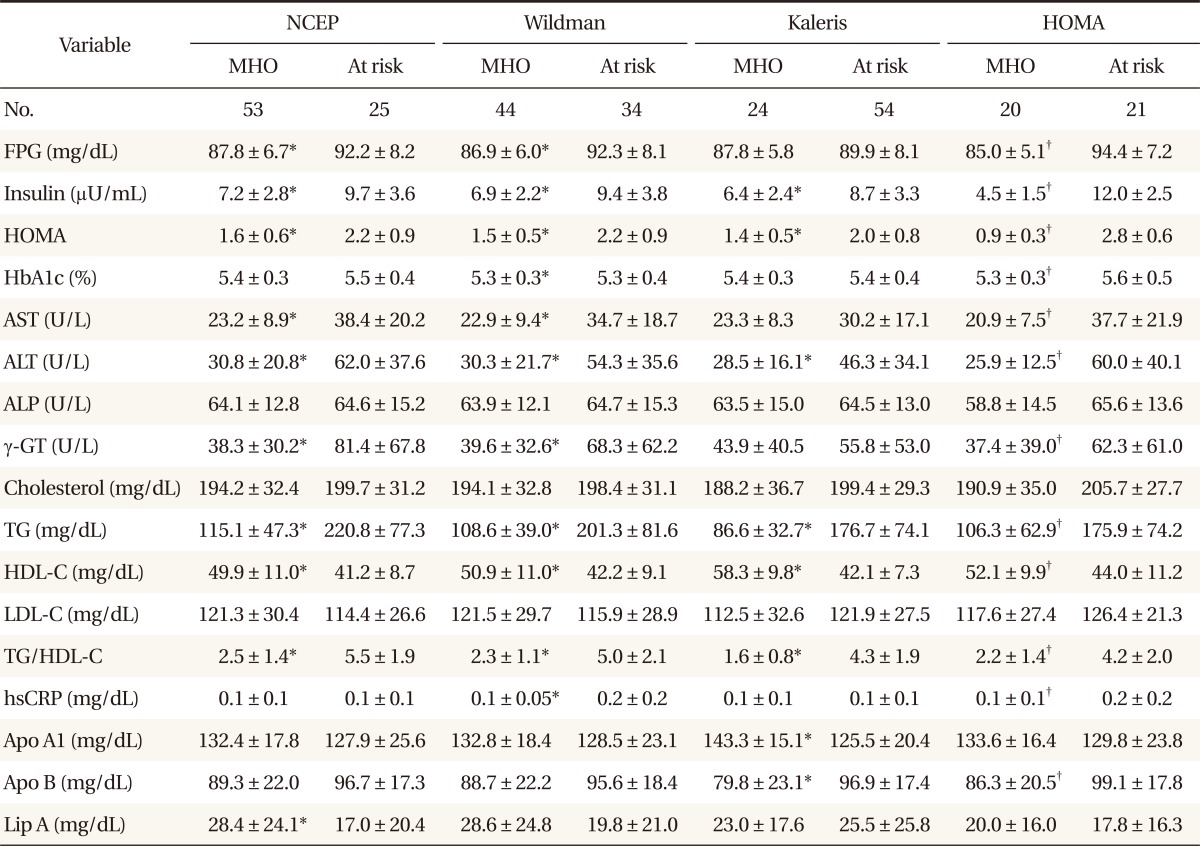
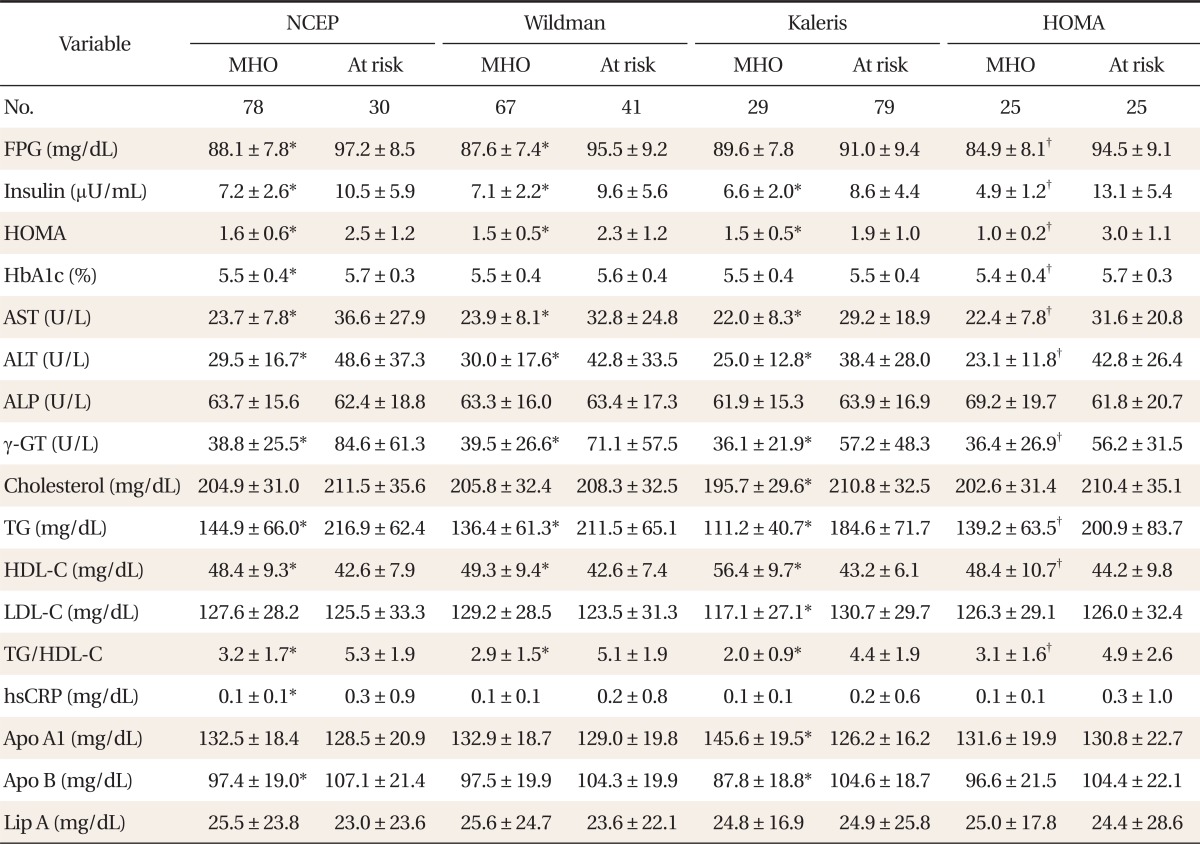
The results of assessments of the diagonal agreement between pairs of diagnostic criteria according to the pertinent value of kappa were as follows: NCEP and Wildman criteria, 0.8 (P < 0.001); NCEP and Kaleris criteria, 0.3 (P < 0.001); NCEP and HOMA criteria, 0.5 (P < 0.001); Wildman and Kaleris criteria, 0.4 (P < 0.001); Wildman and HOMA criteria, 0.5 (P < 0.001); Kaleris and HOMA criteria, 0.4 (P < 0.001). The value of kappa between the NCEP and Wildman criteria was the highest. After dividing the population by age, the kappa statistical agreements were not statistically different. Comparisons of the demographic, metabolic and health behavioral characteristics between MHO and at-risk individuals were also performed. Among individuals aged 35 years or younger, the MHO subjects had significantly lower weight, WC, BMI, body fat percentage, insulin, HOMA, ALT, TG, HDL-C, and TG/HDL-C ratio than those at risk, regardless of the criteria (P < 0.05). Contrastingly, there were no differences noted for age, height, ALP, total cholesterol or LDL-C, regardless of the criteria. According to the Kaleris criteria, the MHO group included significantly more nonsmokers (P < 0.05), though there were no differences in alcohol consumption or exercise. According to the other criteria, the MHO group showed no differences (Tables 1, 2).
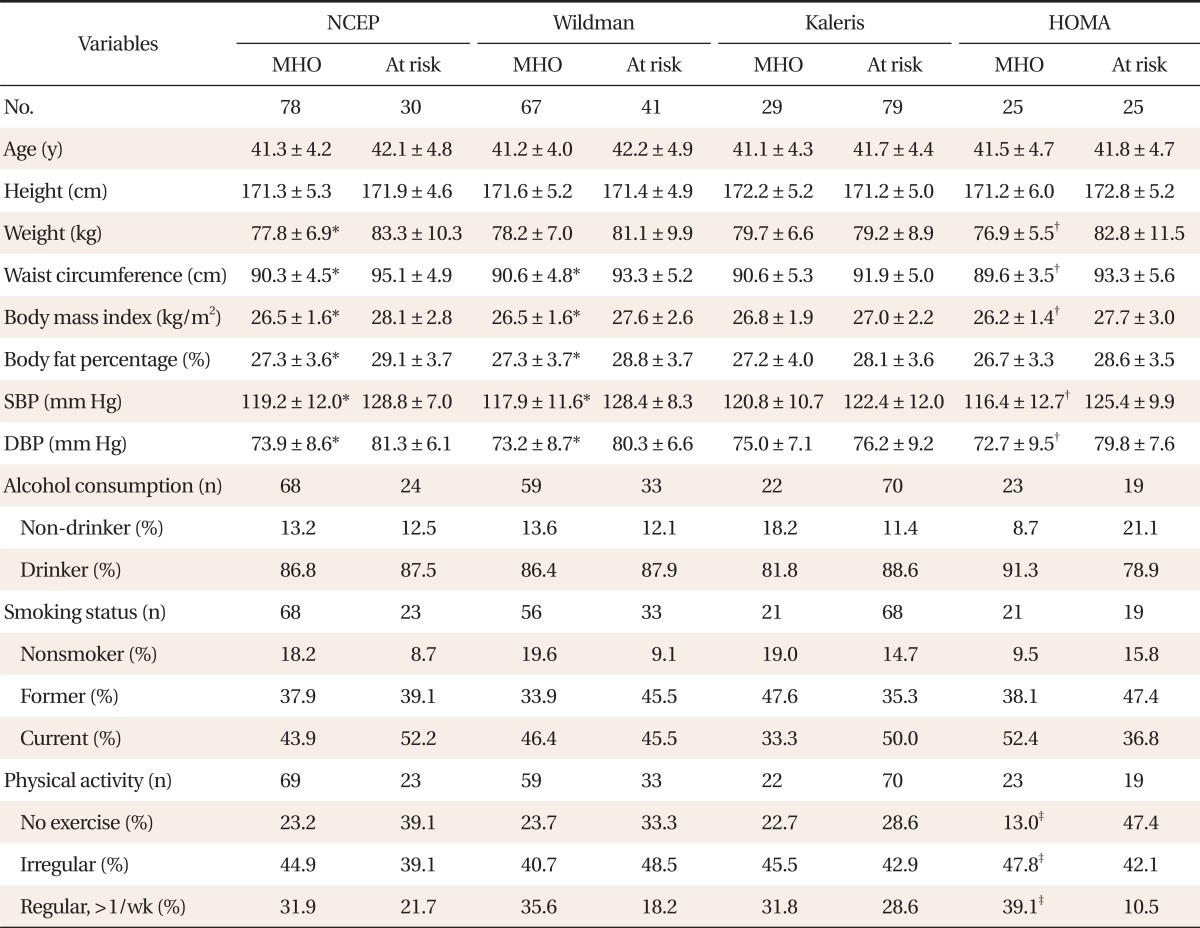
Among older-than-35 individuals, MHO subjects had significantly lower insulin, HOMA, AST, ALT, ╬│-GT, TG, HDL-C, and TG/HDL-C ratio levels than those at risk, regardless of the criteria (P < 0.05). However, for age, height, ALP, and lipoprotein A, there were no differences between the MHO and those at-risk, regardless of the criteria. According to the HOMA criteria, the MHO individuals took significantly more regular exercise (P < 0.05), but for alcohol consumption and smoking, there were no differences. Likewise according to the remaining criteria, the MHO group did not differ from those at risk (Tables 3, 4).
DISCUSSION
In the present study, the prevalence of MHO according to the four criteria among middle-aged obese Korean men were 70.4% by NCEP, 59.7% by Wildman, 28.5% by Kaleris, and 24.2% by HOMA, which indicate that the prevalence of MHO was different according to the criteria used. The previous study showed that MHO prevalence varied, ranging between 3.3% and 32.1% in men and between 11.4% and 43.3% in women according to the criteria used,11) which is a finding consistent with the present study. Although the study participants were different, the findings of other, previous studies were similar in that the prevalence of MHO differed according to the criteria used.3,8,10)
The previous studies also showed that MHO prevalence decreased with increasing age.8-10) Velho et al.9) reported that the prevalence of MHO by Wildman's criteria was 29.2% for 35 to 44 years age group; 22.4% for 45 to 54 years; 10.5% for 55 to 64 years, and 5.2% for 65 to 74 years. In the previous Korean study using Korean National Health and Nutrition Examination Survey data, the prevalence of MHO according to NCEP criteria was 44.3% in overall men, 57.9% for 20 to 39 years, and 38.9% for 40 to 59 years.10) However, there were no differences in MHO prevalence between the 35-and-younger and older-than-35 groups in the present study, because the age ranges of our study participants were relatively narrow and young (almost all of the participants were in their 30s and 40s).
In the present study, the MHO subjects had significantly lower weight, WC, BMI, body fat percentage, insulin, HOMA, ALT, TG, HDL-C, and TG/HDL-C ratio than those at risk, regardless of the criteria, among individuals aged 35 years or younger (P < 0.05). No differences between the MHO and at-risk groups were noted for age, height, ALP, total cholesterol, or LDL-C, regardless of the criteria (Tables 1, 2). Among individuals older than 35 years, MHO subjects had significantly lower insulin, HOMA, AST, ALT, ╬│-GT, TG, HDL-C, and TG/HDL-C ratio (P < 0.05). No differences between the two groups were noted for age, height, ALP, or lipoprotein A, regardless of the criteria (Tables 3, 4). There were few studies examining whether there is an MHO phenotype difference according to age. In a study by Cherqaoui et al.12) on 126 African American individuals (12 male and 114 female), the MHO group had significantly lower WC, HDL-C, LDL-C, and TG levels than the at-risk group among individuals younger than 40 years (P < 0.05), whereas there were no differences for body fat percentage, fasting glucose or BP. Among individuals aged 40 years or older, the MHO group had significantly lower BP, WC, fasting glucose, and HDL-C levels than those at-risk (P < 0.05). There were no differences between the two groups in body fat percentage, total cholesterol, LDL-C, or TG. A large-scale study on MHO phenotypes for various races and ages is needed.
In the present study, the MHO group, according to the Kaleris criteria, had significantly more nonsmokers than the at-risk group among individuals aged 35 years or younger (P < 0.05). A previous study has shown that smoking is associated with metabolic abnormalities and increased risk of metabolic syndrome.13) Smoking can directly reduce insulin sensitivity by increasing levels of circulating insulin-antagonistic hormones (i.e., catecholamines, cortisol, and growth hormone) as well as by increasing lipolysis, resulting in high circulating levels of free fatty acids. Nicotine, carbon monoxide, and other metabolites derived from smoking also play important roles in insulin resistance.13) However, another study showed no relationship between MHO with smoking.9) In the present study, the MHO group according to the HOMA criteria had significantly more regular exercisers than the at-risk group (P < 0.05), which is a finding consistent with Velho et al.9) Exercise leads to increased free fatty acids, glucose usage, and HDL-C, along with reduced insulin resistance, serum triglyceride, and BP.14) No relationship was found with alcohol consumption in the present study. Previous studies have shown controversial results for the relationship of MHO with alcohol.8,9) The beneficial effect of alcohol consumption is increased HDL-C, but a detriment is increased insulin resistance, serum triglyceride, and abdominal obesity. Additional studies on the effects of alcohol consumption on MHO are required.10)
The diagonal agreement (the value of kappa) between the NCEP and Wildman criteria was as high as 0.8 due to the common variables between them, including BP, TG, fasting glucose, and HDL-C. By contrast, the values of kappa between the other criteria were low. Therefore, comparisons among studies on MHO might be difficult due to differences in definitions of MHO and diagonal disagreement among the criteria used. Establishment of an expert consensus should be sought in order to make a standardized protocol for identification of MHO individuals.
The present study has several limitations. First, given the fact that none of the participants had any history of metabolic abnormality (i.e., hypertension, diabetes, cardiovascular disease, thyroid disease, osteoporosis, cerebral infarction), the differences in the demographic and metabolic profiles between MHO and non-MHO individuals might have been underestimated. Second, we applied a cross-sectional approach to a small population (186 individuals), whereas a larger sample size might have been needed to generalize the study results. Additionally, a prospective cohort study might be needed in order to find out whether there are any differences in disease incidences according to the criteria used to define MHO. Third, obesity was defined as a BMI Ōēź 25 in the present study. As muscular and short persons could be misclassified by BMI, further research using methods of direct body-fat measurement such as dual energy X-ray absorptiometry is required.
In conclusion, the differences in MHO prevalence, demographic, and metabolic profiles varied according to the criteria used. We believe that an expert consensus might be needed to standardize the identification protocol for MHO individuals, as the definition of "metabolic syndrome" has been controversial for 20 years.