• KAFM
  • Contact us
  • E-Submission
ABOUT
ARTICLE CATEGORY
BROWSE ARTICLES
AUTHOR INFORMATION

Articles

Commentary

Comments on Statistical Issues in July 2013

Korean Journal of Family Medicine 2013;34(4):293-294.
Published online: July 24, 2013

Department of Biostatistics, The Catholic University of Korea College of Medicine, Seoul, Korea.

Copyright © 2013 The Korean Academy of Family Medicine

This is an open-access article distributed under the terms of the Creative Commons Attribution Non-Commercial License (http://creativecommons.org/licenses/by-nc/3.0/) which permits unrestricted noncommercial use, distribution, and reproduction in any medium, provided the original work is properly cited.

  • 3,174 Views
  • 23 Download
  • 1 Crossref
  • 1 Scopus
prev next
In this section, we explain the solutions for numerical problems which occurred frequently in analyzing multiple logistic regression with too many explanatory variables considering their sample size, which appeared in the article titled, "Effects of brief smoking cessation education with expiratory carbon monoxide measurement on level of motivation to quit smoking", published in May 2013 by Choi et al.1)
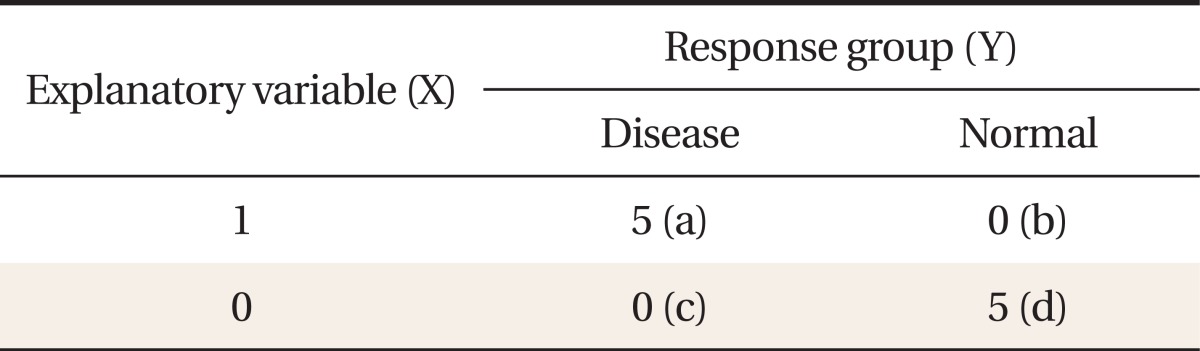
We often confront various numerical problems such as non-convergence in estimating regression coefficients, unreasonably large standard errors, and wide ranges of confidence intervals when analyzing a multiple logistic regression. These problems are caused by certain structures in the data and a lack of appropriate checks in statistical software. We illustrate these data structures in certain simple situations and illustrate what can happen when the logistic regression model is fit to such data. The simplest and thus most obvious situation is when we have a frequency of zero in a contingency table. Consider the following data set (Table 1).
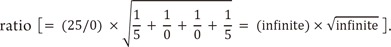
The estimated odds ratio using X = 0 as the reference is infinite [OR = (a/b)/(c/d)] = (5/0)/(0/5) = 25/0] since all subjects are completely divided into disease and normal according to the values of X (complete separation). Note that if either (b) or (c) is equal to zero, then the odds ratio is undefined. The standard error of the estimated odds ratio is estimated by the formula,
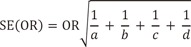
Thus we also obtain an infinite value of standard error for odds
Also note that if any one of the four cell frequencies is equal to zero, then SE(OR) is undefined.
Gart and Zweifel2) suggested improved estimates of OR and SE(OR) which are calculated after adding 0.5 to each cell. According to their suggestion, we obtain OR' = (5.5/0.5)/(0.5/5.5) = 121 and SE(OR') = 252.76.
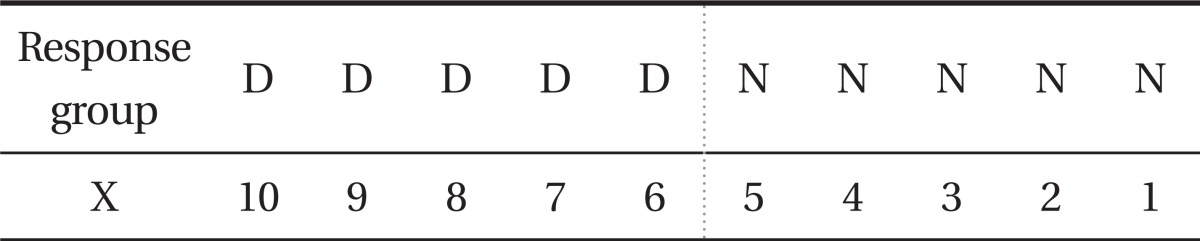
The complete separation can also occur when the values of a continuous explanatory variable are completely divided into both response groups by a certain cut-off as shown in Table 2.
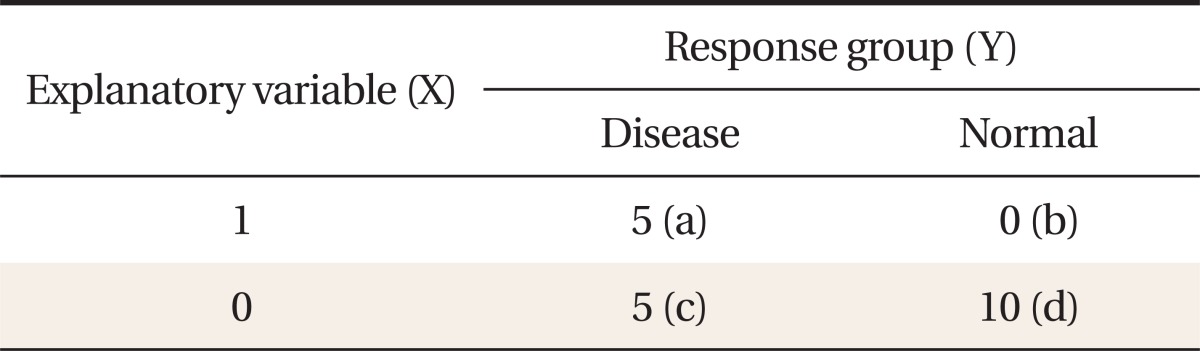
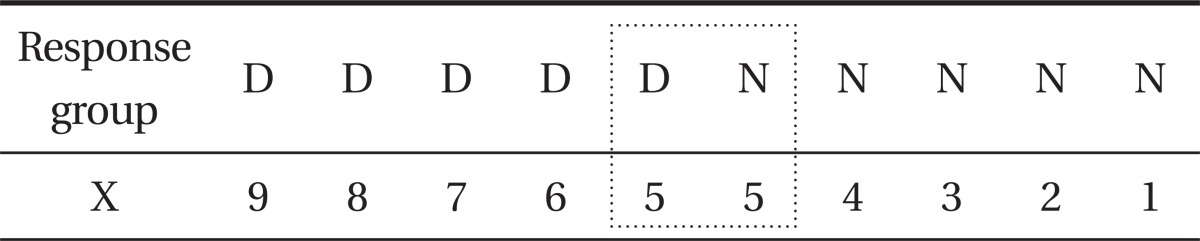
A quasi-complete separation is similar to a complete separation except that there is overlap at a single or a few tied values in both groups. Examples of quasi-complete separations for a discrete and a continuous explanatory variable are presented in Tables 3, 4, respectively.
The values of odds ratio and its standard error cannot be estimated unless we apply the suggested method.
When a multiple logistic model has too many explanatory variables, we run the risk that the data are too sparse to be able to estimate all the regression coefficients. For example, assume that we have only one binary explanatory variable and forty observations which are distributed evenly to four cells, then each cell has at least ten observations and we do not have numerical problems. However, if we have five binary explanatory variables (sixty-four cells) with the same number of observations, then some cells unavoidably have no observations.
In this case, discarding some obviously unimportant variables with univariate analysis may remedy these problems. The best solution for the numerical problems appears to be the penalized likelihood estimation method which is available in SAS ver. 9.2 (SAS Institute Inc., Cary, NC, USA) with the Firth option in the Logistic procedure.

No potential conflict of interest relevant to this article was reported.

  • 1. Choi WY, Kim CH, Lee OG. Effects of brief smoking cessation education with expiratory carbon monoxide measurement on level of motivation to quit smoking. Korean J Fam Med 2013;34:190-198. PMID: 23730486.
  • 2. Gart JJ, Zweifel JR. On the bias of various estimators of the logit and its variance with application to quantal bioassay. Biometrika 1967;54:181-187. PMID: 6049534.
Table 1
A contingency table with a complete separation
kjfm-34-293-i001.jpg
Table 2
Complete separation of a continuous explanatory variable

D: disease, N: normal.

kjfm-34-293-i002.jpg
Table 3
A contingency table with a quasi-complete separation
kjfm-34-293-i003.jpg
Table 4
Quasi-complete separation of a continuous explanatory variable

D: disease, N: normal.

kjfm-34-293-i004.jpg

Figure & Data

References

    Citations

    Citations to this article as recorded by  
    • Comments on Statistical Issues in May 2015
      Yong Gyu Park
      Korean Journal of Family Medicine.2015; 36(3): 154.     CrossRef

    Download Citation

    Download a citation file in RIS format that can be imported by all major citation management software, including EndNote, ProCite, RefWorks, and Reference Manager.

    Format:

    Include:

    Comments on Statistical Issues in July 2013
    Korean J Fam Med. 2013;34(4):293-294.   Published online July 24, 2013
    Download Citation
    Download a citation file in RIS format that can be imported by all major citation management software, including EndNote, ProCite, RefWorks, and Reference Manager.

    Format:
    • RIS — For EndNote, ProCite, RefWorks, and most other reference management software
    • BibTeX — For JabRef, BibDesk, and other BibTeX-specific software
    Include:
    • Citation for the content below
    Comments on Statistical Issues in July 2013
    Korean J Fam Med. 2013;34(4):293-294.   Published online July 24, 2013
    Close
    Comments on Statistical Issues in July 2013
    Comments on Statistical Issues in July 2013

    A contingency table with a complete separation

    Complete separation of a continuous explanatory variable

    D: disease, N: normal.

    A contingency table with a quasi-complete separation

    Quasi-complete separation of a continuous explanatory variable

    D: disease, N: normal.

    Table 1 A contingency table with a complete separation

    Table 2 Complete separation of a continuous explanatory variable

    D: disease, N: normal.

    Table 3 A contingency table with a quasi-complete separation

    Table 4 Quasi-complete separation of a continuous explanatory variable

    D: disease, N: normal.

    TOP