The Association of Body Fat and Arterial Stiffness Using the Brachial-Ankle Pulse Wave Velocity
Article information

Abstract
Background
BMI alone may not serve as an index of obesity because it does not reflect body composition. The present study aimed to compare arterial stiffness as assessed by the brachial-ankle pulse wave velocity (ba-PWV) among groups defined by body fat percentage (pBF) and BMI.
Methods
This cross-sectional study was based on 1,700 participants (1,044 men and 656 women) who completed a health screening examination at a national hospital between January 2011 and February 2016. Participants were divided into four groups according to BMI and pBF: normal fat and normal weight (NFNW); excessive fat and normal weight (EFNW); normal fat and obese (NFO); and excessive fat and obese (EFO). The ba-PWV and other cardiometabolic factors were compared among the four groups in men and women separately.
Results
For both sexes, the NFNW group had a lower metabolic risk compared to that in the other groups (EFNW, NFO, and EFO). After adjusting for multiple variables, the NFO males had a significantly lower ba-PWV compared to those in the other groups, including NFNW males. The NFO group had significantly more skeletal muscle mass and muscle mass compared the other groups (P<0.05). Among women, the NFNW group had a significantly lower ba-PWV compared the other groups, even after adjusting for multiple variables.
Conclusion
Lower pBF in obese men may be associated with improved cardiovascular risk.
INTRODUCTION
Obesity is associated with increased incidence and mortality from cardiometabolic complications such as diabetes mellitus (DM), dyslipidemia, hypertension (HTN), cardiovascular disease (CVD), and several cancers [1]. The prevalence of many of these medical complications increases with age [2]. In addition, previous studies showed that the mean body weight gradually increases in adults life and assumes the peak values at 50–59 years [3]. The World Health Organization defines overweight and obese as excessive fat accumulation [4]. Among the various indices used to assess obesity, body mass index (BMI) is a simple measure widely used to define overweight and obese. However, BMI alone is limited as an index of obesity because it does not reflect body composition [5]. Waist circumference and body fat percentage (pBF) are strongly associated with metabolic syndrome and CVD risk, and a study on sarcopenia reported that muscle mass (MM) was negatively associated with atherosclerosis [6,7]. In addition, several previous studies have shown that those with high pBF despite a normal body weight have an increased CVD risk [8]. In contrast, few studies have investigated CVD risk in obese individuals with high MM (i.e., obese by BMI, but with normal pBF). Obese individuals with more MM and lower pBF may not have a high CVD risk due to MM-related effects.
Atherosclerosis is an important marker of CVD risk as arterial stiffness plays a key role in the pathophysiology of CVD [9]. Arterial stiffness impairs the vascular system by distributing the steady blood flow from the heart into the peripheral capillaries, with a devastating effect on the heart and microcirculation [10]. Pulse wave velocity (PWV) is an indicator of arterial stiffness and a surrogate marker of vascular damage [11]. The brachial-ankle pulse wave velocity (ba-PWV) is easy to measure and is a non-invasive method for assessing arterial stiffness [12].
The present study aimed to investigate arterial stiffness, as assessed by ba-PWV, in obese individuals with high MM. We hypothesized that arterial stiffness in such individuals would not be increased to the same extent as in obese individuals with lower MM (relative to normal weight individuals). In addition, considering the association of age with prevalence of metabolic complications and obesity, this study investigated individuals aged 50 years and older.
METHODS
1. Participants
We conducted a cross-sectional study based on data extracted from the Pusan National University Hospital medical records. Data on healthy subjects who underwent a comprehensive medical examination between January 2011 and February 2016 (n=23,528) were collected. Among them, 4,385 had a ba-PWV assessment and were included in this study. A total of 2,685 individuals were excluded for the following reasons: age <50 years (n=2,100); an ankle-brachial index <0.9, suggesting the presence of peripheral artery disease (n=234); BMI <18.5 kg/m2 (n=151); previously diagnosed with CVD (n=85; CVD includes stroke, myocardial infarction, history of intervention for coronary artery diseases, history of medication for diagnosed angina); missing data (n=37); pregnant (n=11); and a ba-PWV >3.0 standard deviations (SDs) from the mean (n=67). Ultimately, 1,700 participants (1,044 men and 656 women) were included.
Men and women were divided into four groups each, according to BMI and pBF, as follows: normal pBF and normal weight (NFNW); excessive pBF and normal weight (EFNW); normal pBF and obese (NFO); and excessive pBF and obese (EFO). Obesity based on BMI was defined as a BMI ≥25.0 kg/m2, in accordance with the Western Pacific Regional Office of World Health Organization standard for Asians [4]. Excessive pBF was defined as a pBF ≥20.6% for men and ≥33.4% for women, in accordance with a previous study investigating the cut-offs for pBF as a CVD risk factor in Korean adults [13]. The reference value for pBF was used indirectly to classify subjects in terms of MM, as the optimal cut-off value for MM in terms of CVD risk has not been established in Korea. The Institutional Review Board of Pusan National University Hospital approved an exemption for the study protocol (IRB no., H-1612-022-050).
2. Data Collection
1) Baseline characteristics
Weight and height were measured, and BMI was calculated as the weight (kg) divided by the square of the height (m). Body composition measures including pBF (%), percent MM (pMM, %) and percent skeletal MM (pSMM, %) were assessed by bio-impedance analysis (BIA) using a body composition analyzer (Model X-scan plus II; Jawon Medical Co., Seoul, Korea). Systolic blood pressure (SBP) and diastolic blood pressure (DBP) were assessed using an automated oscillometric monitor (Model TM-2655P; A&D Medical, Tokyo, Japan) placed on the right arm after a 5-minute rest in a sitting position.
All participants completed a questionnaire and were interviewed by a physician regarding their medical history, family history, smoking status, alcohol consumption, and exercise habits. A history of DM, HTN, and dyslipidemia were defined as a history of medication or a diagnosis by a physician; a history of CVD was defined as a history of myocardial infarction or intervention for coronary artery disease, and a history of medication for diagnosed angina. Smoking status consisted of smokers (current and ex-smokers) and non-smokers (those who had never smoked). Moderate drinking was defined as consuming over 14 g of alcohol per day for women and over 28 g of alcohol per day for men [14]. Regular exercise was defined as exercising more than 3 times per week at moderate to vigorous intensity, with an average of 40 minutes per session [15].
2) Brachial-ankle pulse wave velocity measurement
Arterial stiffness was assessed by ba-PWV using an automated device (Model BP-203RPE-III; Omron, Kyoto, Japan). Measurements were performed in the supine position after a 5-minute rest. The instrument obtained waveforms from sensors in cuffs on the right brachium and both ankles. The ba-PWV value was automatically calculated according to the ‘transmission time’ and ‘transmission distance.’ Transmission time refers to the time intervals (Tba) between the brachium and the ankle and was automatically recorded. The transmission distance refers to the distance between the sampling points of ba-PWV (the right arm to each ankle) and was calculated according to height using the following equation: ba-PWV=(La-Lb)/Tba. Lb represents the length from the suprasternal notch to the right brachium using the following equation: Lb=0.2195×height (cm)-2.0734. La represents the length from the suprasternal notch to the ankle using the following equation: La=0.8129×height (cm)+12.328 [16].
3) Laboratory measurements
Blood samples were drawn from the antecubital vein after an overnight fast of at least 8 hours. The blood samples were analyzed at a certified laboratory. Total cholesterol, high-density lipoprotein cholesterol, triglyceride levels, and low-density lipoprotein (LDL) cholesterol were assessed by the enzymatic colorimetric method using a Hitachi 7600 Analyzer (Hitachi Co. Ltd., Tokyo, Japan). High sensitivity C-reactive protein levels were assessed using a Behring BN II Nephelometer (Dade Behring, Marburg, Germany). Fasting plasma glucose (FPG) was assessed by the glucose oxidase method using a Synchron LX 20 (Beckman Coulter, Fullerton, CA, USA). Fasting insulin was assessed by radioimmunoassay (Diagnostic Product Co., Los Angeles, CA, USA) using antibody-coated tubes. The homeostasis model assessment of insulin resistance (HOMA-IR) index was calculated using the following formula: HOMA-IR=fasting serum insulin (mU/mL)×FPG (mmol/L)/22.5 [17].
3. Statistical Analysis
Statistical analyses were conducted separately in men and women, as most of the general characteristics differed between men and women. Baseline characteristics are presented as means and SD for normallydistributed continuous variables, and as median (first quartile, third quartile) for continuous variables with a skewed distribution. Categorical variables are expressed as frequencies (n, number) and percentages (%). Group differences were evaluated using an analysis of variance (ANOVA) for normally distributed variables and the Kruskal-Wallis test for non-normally distributed variables. Group differences in categorical variables were evaluated using the chi-square test.
Since the right and left ba-PWV were positively correlated in men (r=0.899, P<0.001) and women (r=0.948, P<0.001), the mean of the right and left ba-PWV (bilateral ba-PWV) was used in the analyses. In addition to an ANOVA, group differences in the bilateral ba-PWV were evaluated using an analysis of covariance, adjusting for age, smoking, exercise, drinking, LDL cholesterol, and histories of DM and HTN. The Pearson correlation coefficients or the spearman correlation coefficient between ba-PWV and the body composition indices were calculated.
All statistical analyses were performed using PASW SPSS ver. 18.0 for Windows (SPSS Inc., Chicago, IL, USA). A two-tailed P-value <0.05 was considered statistically significant.
RESULTS
1. Baseline Characteristics for Male Participants
The general characteristics of the male participants (n=1,044) are shown in Table 1. Age was not significantly different among the four groups (P=0.371). The proportion of male participants in the NFO group was small (2.0%, n=21). The NFO group comprised of a smaller ratio of participants with moderate drinking or greater (P=0.011). However, a ratio of smokers and participants performing regular moderate exercise were not significantly different among the four groups.

Baseline characteristics according to combined BMI and pBF groups (men)
The NFNW group had the lowest pBF and BMI among the four groups. The obese groups had a significantly higher pBF and lower pMM compared to those in the respective normal weight groups (NFNW versus NFO, P<0.05 for pBF and pMM; EFNW versus EFO, P<0.05 for pBF and pMM). BMI was significantly different among the groups (P<0.05), and was significantly lower in the normal pBF groups compared to those for the respective excessive pBF groups (NFNW versus EFNW, P<0.05; NWO versus EFO, P<0.05). In addition, the NFO group had significantly more SMM and MM compared to the other groups (all P<0.05).
Several metabolic measures (SBP, DBP, total cholesterol, triglyceride, LDL cholesterol, fasting insulin, and HOMA-IR) were significantly lower in NFNW compared to the excessive pBF groups. After adjusting for age, the results were similar to the main findings, since the NFNW group presented with lower metabolic risk compared to the excessive pBF groups.
2. Baseline Characteristics for Female Participants
The general characteristics of the female participants (n=656) are shown in Table 2. The proportion of female participants in the NFO group (6.6%, n=43) was similar to the proportion of male participants (2.0%, n=21). The female participants in the excessive pBF groups (EFNW, EFO) were significantly older compared to those in the normal pBF groups (NFNW, NFO) (P<0.05). There were no significant group differences in smoking (P=0.235), drinking (P=0.636), or exercise habits (P=0.790).
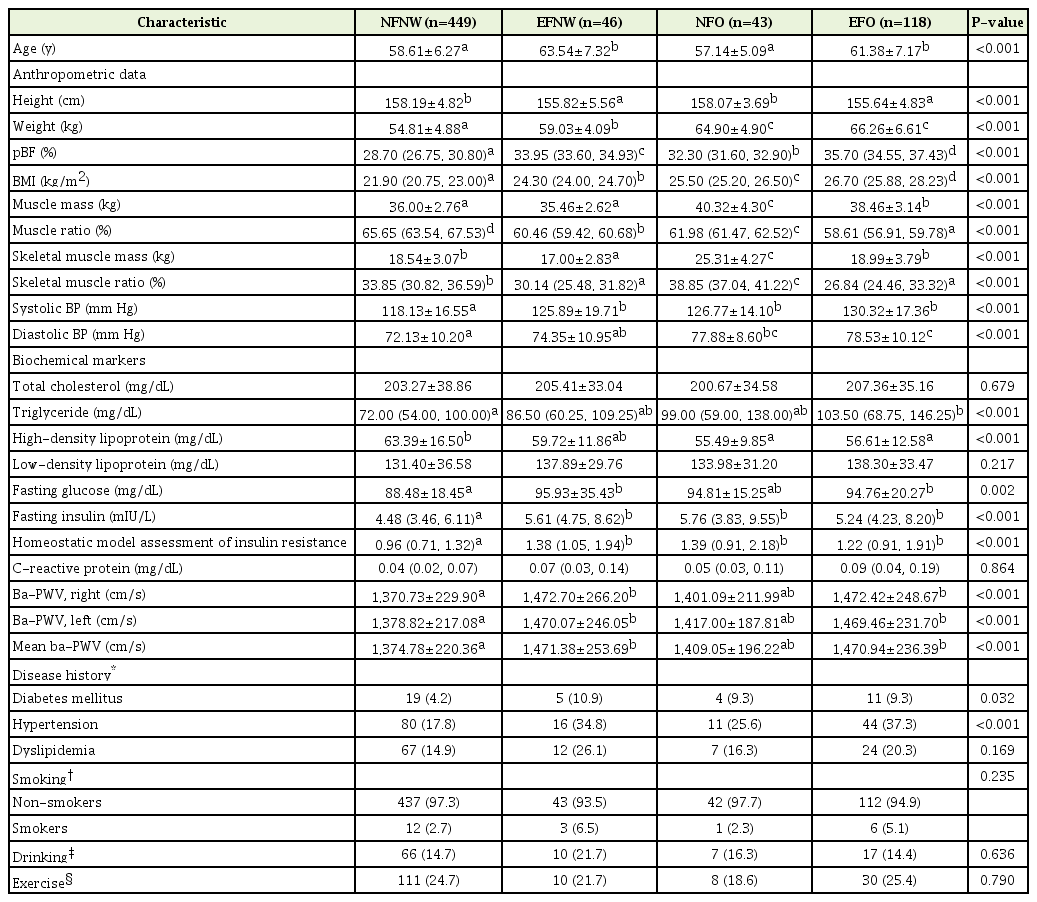
Baseline characteristics according to combined BMI and pBF groups (women)
The group differences in body composition were similar to those in men. The NFNW group had significantly lower pBF and BMI compared to the other groups (P<0.05). The obese groups had a significantly higher pBF and lower pMM compared to those in the respective normal weight groups, and the BMI was significantly lower in normal pBF groups compared to those in the respective excessive pBF groups (P<0.05). The NFO group had significantly more SMM compared to those in the NFNW and EFNW groups (P<0.05). In addition, the NFO group had significantly more MM compared to those in the other groups (P<0.05).
Similar to the results for the male participants, the NFNW group had lower values for metabolic factors including blood pressure (BP), triglyceride, fasting glucose, fasting insulin, and HOMA-IR compared to other groups. After adjusting for age, the NFNW group presented with lower metabolic risk compared to the other groups, similar to what was found in men.
3. Correlation between Body Composition and Brachial-Ankle Pulse Wave Velocity
Although BMI was not significantly correlated with ba-PWV in men (P=0.959), body composition indices, such as pBF, MM (kg), pMM (%), SMM (kg) and pSMM (%) were significantly correlated with ba-PWV (all P<0.05). While pBF was positively correlated with ba-PWV, MM, pMM, SMM and pSMM were negatively correlated with ba-PWV (Table 3).
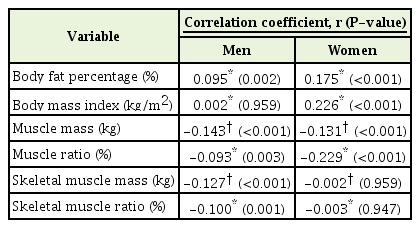
Correlations between body composition indices and brachial-ankle pulse wave velocity
Unlike in men, BMI was significantly and positively correlated with ba-PWV in women (P<0.001). MM and pMM were negatively correlated with ba-PWV; however, SMM and pSMM were not significantly correlated with ba-PWV (MM, P<0.001; pMM, P<0.001, SMM, P=0.959; pSMM, P=0.947) (Table 3).
4. Brachial-Ankle Pulse Wave Velocity Comparisons
The ba-PWV was not significantly different among the four groups in men (P=0.109) (Table 4). However, the ba-PWV was significantly lower in NFO group compared to other groups (all P<0.05) in men. After adjusting for multiple variables (age, smoking, exercise, drinking, LDL, and a history of DM and HTN), the ba-PWV in the NFO group was still significantly lower compared to other groups (all P<0.05). In addition, the ba-PWV in the NFO group was significantly lower compared to the NFNW group (P=0.006) (Table 4, Figure 1).

Comparisons for ba-PWV according to combined body mass index and body fat percentage groups and adjusted multiple variables
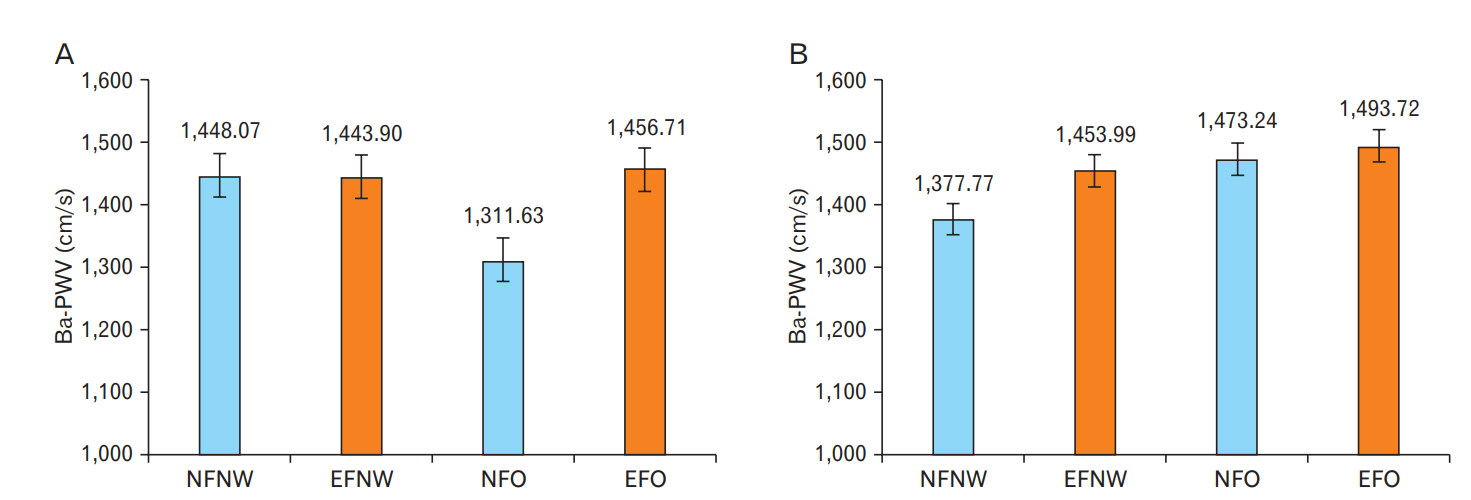
Ba-PWV according to combined BMI and BF groups after adjusting for multiple variables. Blue bars represent the normal pBF groups and red bars represent the excessive pBF groups. (A) Ba-PWV according to combined BMI and BF groups in males (P=0.015). (B) Ba-PWV according to combined BMI and BF groups in females (P=0.040). P-values were calculated using an analysis of covariance. Ba-PWV, brachial-ankle pulse wave velocity; BMI, body mass index; BF, body fat; pBF, body fat percentage; NFNW, normal fat and normal weight; EFNW, excessive fat and normal weight; NFO, normal fat and obese; EFO, excessive fat and obese.
In women, the ba-PWV in the NFNW group was significantly lower compared to the excessive pBF groups (EFNW, EFO) (P<0.001) (Table 4). After adjusting for multiple variables, the ba-PWV in the NFNW was still significantly lower compared to those in the EFO group (P<0.001) (Table 4, Figure 1).
DISCUSSION
The present study compared the ba-PWV as an index of arterial stiffness among groups classified according to BMI and pBF. Several previous studies have shown that individuals with high pBF despite a normal body weight have an increased CVD risk [8]. However, the converse has not been well-studied (i.e., CVD risk in obese individuals with high MM). Thus, we evaluated whether ba-PWV was higher in NFO individuals compared to that in normal weight groups.
In men, the ba-PWV was the lowest in the NFO group, after adjusting for multiple variables. In particular, the ba-PWV was lower in NFO males compared to NFNW males, despite a higher BMI and pBF in the NFO males. This result may suggest that obese men with normal body fat do not have a higher CVD risk compared to those with a normal weight and normal body fat. However, since few studies have investigated the cardiometabolic risk in obese individuals with normal body fat, it is not currently clear whether NFO status has some cardiometabolic benefits, and the clear mechanisms have not been established.
In the present study, pBF in the NFO males were significantly higher compared to NFNW males, and metabolic risk factors (e.g., BP, lipid profiles, and glucose index) were significantly higher in the NFO males compared the NFNW males. It is well known that the excessive body fat in obese individuals is related to metabolic diseases, such as HTN, DM and dyslipidemia, which are risk factors of CVD [1]. Despite higher metabolic risk, ba-PWV in the NFO males were significantly lower compared to the NFNW males. Considering these results, it may be possible that there were other factors related to arterial stiffness, rather than metabolic factors associated with body fat. In comparing body composition among the four groups of men, quantified MM (kg) and SMM (kg) were higher in the two obese groups (NFO, EFO) compared to those in the NFNW group. This difference in quantified MM could affect the ba-PWV values.
There have been previous studies regarding sarcopenia that investigated association of MM and atherosclerosis. Ochi el al. [7] in 2010 reported that arterial stiffness was negatively associated with high MM in men, but not in women. In contrast, Jensky el al. [18] in 2013 failed to show an association between abdominal lean muscle area and atherosclerosis. Consistent with Ochi el al. [7] in 2010, the present study showed that SMM is negatively associated with ba-PWV in men, but not in women, while pBF is positively associated with ba-PWV in both sexes. Furthermore, among the evaluated body composition indices, MM had a higher correlation with ba-PWV than with pBF in men. These results suggest that MM may be related to arterial stiffness in addition to pBF. Furthermore, pBF and MM were independently associated with ba-PWV in a multiple regression analysis.
The effects of muscle on vascular function could be considered as a mechanism underlying the lower ba-PWV in NFO males. An association between obesity and cardiovascular function related to endothelial control has been reported [19,20]. For example, in a study using obese mice, increased MM due to a genetic deletion affecting myostatin was associated with improved maximum vasodilation, suggesting that more MM benefits vasodilation, independent of exercise [20]. This may support the finding in the present study that ba-PWV in NFO males was lower compared to other groups, independent of metabolic effects. Thus, the present results suggest that MM may have protective effects on arterial stiffness in obese men; increasing MM through resistance exercise should be emphasized to obese men, in addition to oxidative exercises, such as walking.
Of note, ba-PWV in EFO males did not differ significantly from those in NFNW males, even after adjusting for multiple variables. As described above, the beneficial effect of MM on arterial stiffness could be related to the lack of a difference in ba-PWV between EFO and NFNW males. In addition, the association of obesity and arterial stiffness was somewhat controversial in older individuals [21] In the present study, BMI was not significantly correlated with ba-PWV in men, which is in accordance with previous studies [22]. These results may be due to several cardiovascular risk factors such as DM, HTN and dyslipidemia in older individuals.
In contrast to the results for men, the ba-PWV in NFO females were not lower than for NFNW females, even after adjusting for multiple variables. Among the four groups, NFNW females had the lowest ba-PWV, as well as the lowest BMI and pBF (similar to the men). In women, other obesity indices may have a stronger association with CVD risk than for BMI or pBF. Some studies using women have shown that visceral obesity is more strongly associated with atherosclerosis and CVD-related mortality than total adiposity or BMI [23,24].
In the present study, substantial sex differences existed in the findings regarding ba-PWV, which could be related to the following factors. First, different pBF cut-offs were used for men and women. Since the pBF cut-off was higher in women, the BMI/pBF groups for the women had a greater pBF and lower MM compared to those for men. However, because of inherent sex differences, the use of different cut-offs may be more appropriate. Second, intrinsic differences in sex hormone levels between men and women may also underlie the results. Differences in the formation and metabolism of adipose tissue and muscle attributable to differences in sex hormone levels between men and women may also affect ba-PWV. In previous studies, testosterone in men increases MM and strength, activating the catabolism and assimilation path of protein. On the other hand, estrogen in women is primarily known to be involved in adipocytes [25]. Sex differences in sex hormone levels may also affect vascular function. A previous study suggested that estrogen effects vascular function relating to perivascular adipose tissue, as the ovariectomy of female rats attenuated the vasodilatory effects of perivascular adipose tissue [26]. Moreover, the immunosuppressive activity of estrogens has also been established in several models of inflammatory disease [27]. An increase in inflammatory markers is clearly associated with obesity and CVD risk [28].
The present study has several limitations. First, the causal relationships between body composition and arterial stiffness were not addressed due to the cross-sectional nature of this study. Second, the number of participants within each group was significantly different in both sexes. In both sexes, fewer participants comprised the NFO group; thus, some caution in interpreting the results are needed. Third, the information regarding the medical and social histories were collected using a self-report questionnaire and an interview with a physician. Thus, some differences may exist between the information obtained by the physician and those obtained by the questionnaire, leading to difficulties in obtaining correct medical history information, especially those regarding medications. It is possible that the adjustment for medical history variables may not have been appropriate. However, as physicians interviewing subjects were educated on history taking, this limitation should be minimized. Fourth, the ba-PWV has large test-retest variability [16]. However, the present study excluded outliers (defined as a ba-PWV over 3.0 SD above the mean). Fifth, body composition was assessed using BIA, and the accuracy of BIA is lower than that of dual energy X-ray absorptiometry. However, the benefit of using the BIA measurement is that it is inexpensive and easily administered in clinical practice. Finally, the participants in the present study were selected among those who had a comprehensive health examination including the ba-PWV test, which may have led to a selection bias. The participants may have more health concerns, or may already have some problems related to CVD or metabolic disease. However, individuals with a diagnosis of CVD were excluded.
The strengths of the present study are that it used ba-PWV as an outcome measure, unlike previous studies, which have mainly used lipid profiles, insulin resistance, or BP to evaluate associations between cardiometabolic risk and obesity indices [8]. Using arterial stiffness assessed by ba-PWV as an outcome measure may be a more direct index for evaluating CVD risk compared to other cardiometabolic factors. Furthermore, the present study compared cardiometabolic risk among groups according to combined obesity indices (pBF and BMI); therefore, the present study provides information regarding arterial stiffness in NFO individuals, who have not received much research attention to date.
In conclusion, the NFO group in men had the lowest ba-PWV, but did not show a more favorable metabolic profile compared to those in other groups. Future studies are needed to investigate other features that may have effects on vascular function that were not included in the present study.
Notes
No potential conflict of interest relevant to this article was reported