INTRODUCTION
It is widely believed that a regular diet consisting of three meals is healthy, and it is encouraged despite limited epidemiological and clinical evidence. Daily meal frequency is likely to be associated with food choices and lifestyles. Modern westernized lifestyles feature irregular eating patterns, such as skipping meals [1]. Reduced meal frequency by intermittent fasting has attracted much attention worldwide [2-4]. Kahleova et al. [5] reported in the Adventist Health Study 2, a relatively healthy North American cohort, that eating one or two daily meals was associated with a relatively lower body mass index (BMI) compared with three daily meals. Conversely, other studies demonstrated that a high daily meal frequency was associated with high leisure-time physical activity, non-smoking, low alcohol consumption, low caloric intake from fat alcohol, high caloric intake from carbohydrates, and high relative fiber intake [6].
There is a general consensus that breakfast improves consumersŌĆÖ diet and nutrition compared to breakfast skipping [7-10]. Previous studies have shown a close relationship between breakfast skipping and nutritional inadequacy. However, the impact of meal frequency and regularity, including lunch and dinner, has not been established. Most Asian countries, including Korea, now have diverse eating patterns due to the adoption of Western eating patterns. However, there are few studies on the association between the regularity and frequency of daily meals and individual nutritional status.
This study aimed to determine whether young and middle-aged Korean adults achieved a balanced diet and nutrition and to estimate possible nutritional differences between groups according to meal frequency. We hypothesized that a regular breakfast-lunch-dinner meal pattern, compared to irregular diets (IRDs) or meal skipping, would be related to higher diet quality and a healthier clinical parameter overall.
METHODS
1. Study Population
This cross-sectional study utilized data from the seventh Korea National Health and Nutrition Examination Survey (KNHANES) conducted between 2016 and 2018. Of the 24,269 subjects who had completed laboratory blood tests, physical examinations, and surveys during the participation, only 19,389 people aged 19 or older were included. We defined young adults in the present study as individuals aged 19ŌĆō49 years. Of the 24,269 subjects who had completed laboratory blood tests, physical examinations, and surveys during the participation, only 19,389 people within the age bracket were included. We further excluded participants with missing data on meal frequency, food intake, and nutrition. Thus, 7,725 subjects (3,270 men and 4,455 women) were included in the final analysis.
2. Collection of Study Data
The general characteristics of the subjects were collected using standardized questionnaires. The data collected included age, sex, living status, marital status, education level, household income, place of residence, smoking, alcohol consumption, physical activity, dietary supplement, subjective health level, and subjective body shape. Age was classified as 19 to 29, 30 to 39, or 40 to 49 years old. The highest level of public education was divided into four groups: university, high school, middle school, and elementary school. Household income was also categorized into four groups: high, middle-high, middle-low, or low income. The place of residence was classified as urban or rural. Smoking consumption was divided into three groups: non-smokers or smokers of less than five packs (100 cigarettes) in their lifetime, ex-smokers who have smoked more than five packs in their lifetime, or current smokers regardless of the amount of smoking. We categorized alcohol consumption into four groups according to the frequency of drinking during the last year: non-drinkers who did not drink alcohol, mild-drinkers who drank less than once a month to 2ŌĆō4 times a month, moderate-drinkers who drink 2ŌĆō3 times a week, and heavy-drinkers who drank more than 4 times a week. Subjects were placed in the regular physical activity group upon meeting one of the following conditions: (1) more than 3 days per week of vigorous physical activity for 20 minutes or more, (2) more than 5 days per week of moderate physical activity for 30 minutes or more, or (3) more than 5 days a week of walking for 30 minutes or more.
3. Meal Frequency
Meal frequency was assessed using the question, ŌĆ£How many times a week did you have breakfast/lunch/dinner last year?ŌĆØ Only those checked 5 to 7 times a week were considered regular meals. For example, if breakfast is eaten 4 times/wk, 5 times/wk for lunch, and 6 times/ wk for dinner, this is regarded as a regular diet consisting of only two meals (i.e., lunch and dinner). Meal frequency was analyzed by combining the number and type of meals (breakfast, lunch, and dinner). According to the dietary survey, study subjects were further categorized into four groups based on meal frequency. The three-meal regular diet (3MRD) group included those who eat breakfast, lunch, and dinner more than 5 times a week. The two-meal regular diet (2MRD) group included those who eat breakfast and lunch, breakfast and dinner, or lunch and dinner regularly more than 5 times a week. Lastly, the one-meal regular diet (1MRD) group included those who eat only breakfast, only lunch, or only dinner regularly. Those who did not eat any meal more than 5 times a week were placed in the IRD group.
4. Dietary Assessment
Food and nutrient intake was assessed by using the 24-hour recall method. Individual foods were categorized into 18 groups based on previous studies: total food, cereal and grain products, potatoes and starches, vegetables, seaweeds, meat and their products, eggs, legumes, seeds and nuts, mushrooms, fish and selfish, fruits, sugars and sweets, seasonings, milk and dairy products, beverages, liquor, oils and fats, and other foods. Daily energy and nutrient intake, including intake of total calories (kcal/d), carbohydrates (g/d), protein (g/d), and fat (g/d), were assessed. Total energy intake was calculated considering all foods consumed during 1 day before examination. The method was validated in Korea and published by the rural department administration Korean ministry of food, agriculture, forestry, and fisheries. We determined the inappropriateness of micronutrients based on the estimated average requirement (EAR) from Korean Dietary Reference Intakes (KDRIs).
5. Statistical Analysis
Descriptive statistics were used to present the general characteristics of the study subjects. Univariate associations between risk factors and meal frequency were evaluated using PearsonŌĆÖs chi-square test. Multivariable-adjusted associations between meal frequency and food intake or nutrients were evaluated using general linear model analysis, taking into consideration the sampling weights for the standard Korean population. P-value <0.05 (two-sided) was considered statistically significant. Statistical analyses were performed using IBM SPSS Statistics ver. 24 for Windows (IBM Corp., Armonk, NY, USA).
6. Ethics Statement
The study was approved by the Institutional Review Board of the Samsung Medical Center (IRB no., SMC 2021-06-136). The informed consent requirement was waived because the subjects had given consent for the KNHANES. The dataset is in the public domain and does not include individually identifiable information.
RESULTS
The general characteristics of the study subjects are shown in Table 1. Overall, the majority of the subjects had a 2MRD (n=3,680), followed by 3MRD (n=2,841), 1MRD (n=1,019), and IRD (n=185). A 3MRD was more prevalent among those aged 40 and older, while those aged 19 to 39 more commonly ate two regular meals per day. Females were more likely to be irregular dieters (75.7%) and eat one regular meal daily (69.9%). Higher proportions of living alone and non-married status were found among IRD group. The proportion of people with low educational levels was high in the IRD group. Current smokers and drinkers were likely to eat two regular meals per day. The income level, place of residence, and physical activity were not related to the number of meals. People who eat more regularly tend to take dietary supplements. Subjective health level was directly proportional to the number of regular meals, while subjective body shape tended towards obesity as the number of meals decreased. The 3MRD group had a significantly lower weight (P<0.001), BMI (P<0.001), waist circumference (P=0.001), systolic blood pressure (P=0.028), and diastolic blood pressure (P<0.001). In addition, the 3MRD group had significantly lower serum fasting glucose (P=0.001), total cholesterol (P<0.001), and triglyceride (P<0.001) levels.
Table 2 shows the food intake of the study population. Dietary intake of cereal and grain products, as well as seaweeds, was directly proportional to the number of regular meals. On the contrary, alcohol and beverage consumption was inversely proportional to regular meals. In the IRD group, potatoes and eggs were the most consumed. The 2MRD group ate fewer fruits and eggs than other groups. It was prominent that 1MRD group most consumed meat, but least consumed vegetables. The intake levels of legumes, fish, fruits, seasonings, milk, and oils, as well as the consumption of sugars and cholesterol, were consistent regardless of the number of regular meals (Table 3). Conversely, the number of regular meals was proportional to the intake levels of energy, water, dietary fiber, carbohydrate, and protein, as well as essential components such as sodium, potassium, calcium, phosphorous, iron, and vitamins B1, B2, and B3. Fat and saturated fat consumption was higher in individuals who ate less than three regular meals daily. Breakfast skippers had a significantly higher intake of meat (P=0.009) and a lower intake of milk (P=0.010), calcium (P=0.002), phosphorous (P=0.035), and riboflavin (P=0.003) than others in the 2MRD group (Supplements 1, 2). Individuals who only have breakfast was shown a higher intake of carbohydrate such as cereal and grain product among the 1MRD group (Supplements 3, 4).
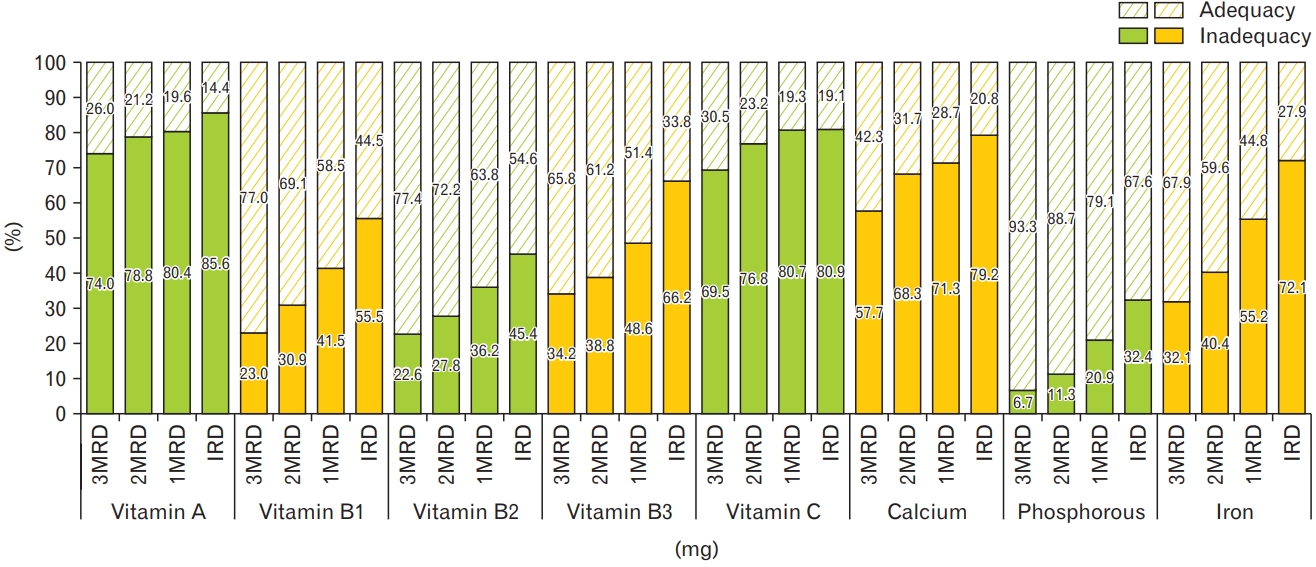
The inadequacy of micronutrients based on EAR from KDRIs is presented in Table 4. The vast majority of study subjects in each meal group showed very low compliance with micronutrient intake recommendations with vitamin A (proportion of population below EAR; 3MRD: 74%, 2MRD: 78.8%, 1MRD: 80.4%, IRD: 85.6%), vitamin C (69.5%, 76.8%, 80.7%, 80.9%), and calcium (57.7%, 68.3%, 71.3%, 79.2%) intakes being below daily dietary recommendations, whereas phosphorous exceeded the daily suggested intakes (Figure 1). Calcium was significantly (P=0.002) deficient in the diet of breakfast skippers (Supplement 5). There was no significant difference in inadequcy of micronutrients among 1MRD group (Supplement 6).
DISCUSSION
To our knowledge, this is the first study to evaluate dietary patterns and nutritional status by meal frequency. We also assessed the importance of regular intake of breakfast, lunch, and dinner. In accordance with our hypotheses, our findings suggest that regularly eating three meals per day is beneficial for young and middle-aged Korean adults. Women who lived alone, were unmarried, or had low educational attainment were likely to eat irregularly and subjectively feel obese and unhealthy. Bae et al. [11] assessed different health behaviors between single- and multiple-member households. They found that women who lived alone ate less food high in fat and exercised more. However, income level, place of residence, and physical activity, which are known confounding factors, are not associated with meal frequency in our study.
Numerous epidemiological studies reported that high eating frequency has a potential protective effect on body composition. Schoenfeld et al. [12] conducted a meta-analysis of 15 studies to establish the effect of eating frequency on fat reduction. Frequent feedings enhance the retention of free fat mass, possible muscle protein accretion, and postprandial thermogenesis, the increase in heat production that occurs for up to 8 hours after a meal. [13] This result was supported by Canuto et al. [14] with a systematic review of 31 articles that showed an inverse relationship between eating frequency and the BMI and visceral obesity of men. It has been hypothesized that increased eating frequency also affects appetite control and improves dietary-induced thermogenesis, lipidemia, and glycemia [15-17]. High meal frequency generally led to lower peaks (P<0.05) in perceived appetite, satiety, glucose, insulin, ghrelin, and PYY responses compared with low meal frequency [18]. Controlled feeding studies conducted by Leidy and Campbell [19] suggested that high meal frequency (>3 meals per day) has minimal, if any, impact on appetite control and food intake, whereas low meal frequency (<3 meals per day) negatively affects appetite control.
Daily meal frequency have been related to differences in dietary quality. Holmback et al. [6] indicated that increased eating frequency was associated with increased energy derived from carbohydrates, increased relative fiber intake, and less energy derived from protein and fat. Our results were similar except for increased protein consumption in the 3MRD group. The group also showed a higher intake of calories, macronutrients, and micronutrients than other groups. Except for the 3MRD group, none of the groups met the EAR of energy intake. We believed that reducing caloric intake rather than eating frequency was more relevant in preventing weight gain [20]. However, calorie restriction was not associated with weight loss in our study. Reduced meal frequency is associated with an irregular eating pattern that could cause weight gain by increasing hunger-related hormones, ultimately leading to metabolic disturbances that may increase cardiovascular risk [21]. Thus, a regular meal pattern potentially has positive effects on health outcomes regardless of meal frequency.
In this study, the participants of the KNHANES, a large nationwide population-based sample with a high response rate, were representative of the source population. We only included young and middle-aged adults from 19 to 49 because the nutrition plan for sedentary women is different from that of premenopausal women [22]. In addition, retirement, a major transition in life, affects food habits [23,24]. Previous studies have defined the frequency of meals based on the dichotomous responses to the question, ŌĆ£did you have breakfast/lunch/dinner yesterday?ŌĆØ 25) We attempted to overcome this source of potential bias by assessing meal frequency and regularity over an average of 1 week per year, and at least five meals a week were determined as regular meals [26].
This study was limited by recall bias, as a self-reported questionnaire was used with a 24-hour recall method. Furthermore, snack survey items were not collected and could affect the results in the 7th KNHANES. It is also a cross-sectional study and thus cannot determine causal inference. However, by adopting stratification, clustering, and sample weight variables, the study population was a nationally representative estimate of the Korean population. Studies that include Koreans remain very limited. Additional well-defined studies, including food information with snacks, are needed to clarify the role of fasting time with the regularity and frequency of meals.