INTRODUCTION
Globally, coffee consumption has been rising rapidly [1]. In 2018, the worldŌĆÖs average annual coffee consumption per adult was 132 cups per year. In Korea, the average annual coffee consumption per person is 353 cups, indicating that Koreans >19 years of age drink a cup of coffee every day. Coffee consumption in Korea is 2.7 times higher than the worldwide average. In 2018, coffee intake was 1.5 times more than that in 2013 in Korea (228 cups of annual coffee consumption per person) [2]. As coffee intake increases annually, research on the correlation between coffee consumption and health is also being actively conducted.
Coffee and tea contain antioxidants, such as polyphenols, which lower the risk of cardiovascular disease (CVD). In a study by Mineharu et al. [3] using 82,655 Japanese women aged 40ŌĆō79 years, the inverse association between mortality from CVD and coffee consumption was significant. Compared with those who drank <1 cup of coffee per week, multivariable hazard ratio for total CVD among those drinking Ōēź3 cups a day was 2.30 (95% confidence interval [CI], 1.31ŌĆō4.02) [3]. The anti-inflammatory effects of coffee also reduce the risk of cancer and mortality [4], and its antioxidant effect facilitates oxidative DNA damage, mutagenesis, and tumor promotion, thereby leading to anticancer effects [5].
However, in an in vitro bioassay, coffee was found to inhibit mineral availability in rats fed a regular coffee diet. Caffeine and tannin combine with minerals to prevent the absorption of nutrients, such as calcium, magnesium, zinc, phosphorus, and iron [6]. Iron deficiency may increase the risk of anemia.
The global prevalence of anemia, one of the worldŌĆÖs major public health problems, was 32.9% in 2010. Iron deficiency is the most common cause of anemia, affecting the health of 30% of the worldŌĆÖs population, or two billion individuals [7]. According to the Korea National Health and Nutrition Examination Survey (KNHANES) (2010), the prevalence of iron deficiency anemia (IDA) in Korea was 0.7% in men and 8.0% in women, reaching 11.5% in premenopausal women [8]. Additionally, 31.4% of premenopausal women were not anemic, but were in iron deficient [9]. Therefore, inhibition of iron absorption by coffee or tea can play a greater role in premenopausal women with iron deficiency. Nevertheless, to the best of our knowledge, there has been no research on the association between coffee and green tea consumption and IDA in premenopausal women.
Lazrak et al. [10] showed that tea consumption reduced iron absorption in anemic Moroccan women (mean age, 25 years). In women with IDA, median (interquartile range) fractional iron absorption from meals consumed without and with tea was 36.7 (95% CI, 38.2ŌĆō39.8) and 4.1 (95% CI, 2.8ŌĆō6.1), respectively (P<0.001) [10]. Thus, in premenopausal women who are highly vulnerable to iron deficiency, the health effects of inhibiting iron absorption by drinking coffee may be greater than in other populations. There was a significant correlation between coffee or tea intake and biochemical markers of iron status, such as serum hemoglobin and ferritin levels. Therefore, using data from the KNHANES (2010ŌĆō2012), this study aimed to compare serum ferritin and hemoglobin levels according to coffee and green tea consumption to determine the relationship between anemia and coffee or green tea consumption in premenopausal Korean women.
METHODS
1. Data source and Study Population
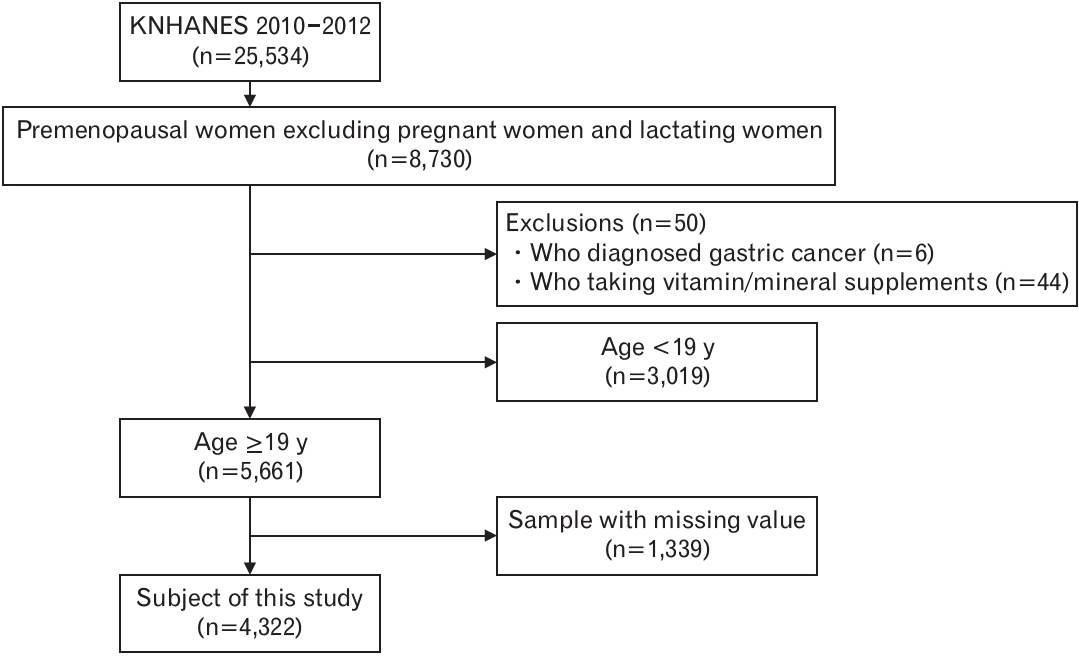
This is a cross-sectional study. This study used data from the fifth KNHANES (2010ŌĆō2012). The KNHANES is a nationwide survey that uses a stratified multistage probability sampling design and consists of a health interview, behavioral and nutritional surveys, and medical examination. A total of 25,534 participants registered in the fifth KHANES (2010ŌĆō2012) were selected. Of this total, 8,730 participants were premenopausal women who were not pregnant or nursing a baby. Additionally, 5,661 participants were included unless they met the following exclusion criteria: (1) diagnosed with gastric cancer, (2) taking vitamin/mineral supplements, and (3) <19 years of age. After excluding 1,339 women with uncertain examination records, 4,322 were ultimately included in the final participant group (Figure 1). This corresponds to a total 10,687,435 individuals when applying the calculated weight compared to the number of people in Korea. This study was conducted after submitting a request for raw data and summary of the use plan on the KNHANES website of the Korea Centers for Disease Control and Prevention and obtaining approval for the use of the data. The study was approved by the Institutional Review Board of Samsung Medical Center (IRB no., SMC 2022-06-145; IRB examination exemption approval, 2022.07.01).
2. Coffee and Green Tea Consumption Assessment
We divided the participants into four categories based on their beverage consumption using the food frequency questionnaire (FFQ) in the KNHANES. Group I consisted of participants who reported drinking less than once daily. Group II included participants who reported drinking alcohol once daily. Group III consisted of participants who reported drinking twice a day, and group IV included those who reported drinking 3 times a day. There were 11 consumption frequency categories in the FFQ of the fifth KNHANES (2010ŌĆō2011): (1) never or rarely, (2) 6ŌĆō11 times a year, (3) once a month, (4) 2ŌĆō3 times a month, (5) once or twice a week, (6) 2ŌĆō3 times a month, (7) once or twice a week, (8) 2ŌĆō3 times a week, (9) once a day, (10) twice a day, and (11) 3 times a day. In the FFQ of the fifth KNHANES (2012), there are nine consumption frequency categories: (1) never or rarely, (2) once a month, (3) 2ŌĆō3 times a month, (4) once a week, (5) 2ŌĆō4 times a week, (6) 5ŌĆō6 times a week, (7) once a day, (8) twice a day, and (9) 3 times a day. Group I (less than once a day) consisted of participants who reported ŌĆ£never or rarely,ŌĆØ ŌĆ£6ŌĆō11 times a year,ŌĆØ ŌĆ£once a month,ŌĆØ ŌĆ£2ŌĆō3 times a month,ŌĆØ ŌĆ£once a week,ŌĆØ ŌĆ£2ŌĆō3 times a week,ŌĆØ and ŌĆ£4ŌĆō6 times a week.ŌĆØ
3. Laboratory Measurements
Blood samples were collected after at least 12 hours of fasting and analyzed in a certified laboratory. Serum hemoglobin level (g/dL) was measured using an XE-2100D (Sysmex, Kobe, Japan). Ferritin levels (ng/mL) were measured using a 1470 Wizard Gamma Counter (PerkinElmer, Turku, Finland).
4. Covariates
In addition to coffee and green tea intake, we investigated potential confounding factors, including age, body mass index (BMI), smoking habits, alcohol consumption, physical activity, dietary intake of iron, education, and comorbidity (hypertension and diabetes mellitus). Smoking was classified as current smoker or nonsmoker. Drinking habits were classified into two groups: more than twice a week and less than twice a week. We divided physical activity status into one of the following practice methods: vigorous physical activity practice, moderate physical activity practice, and walking practice, yes and no, and if not all. Daily iron intake was calculated based on 24-hour dietary recall data. With regards to educational level, the participants were grouped as below elementary school, middle school, high school, and college graduate or above. A history of hypertension or diabetes was defined as a self-reported physicianŌĆÖs diagnosis of hypertension or diabetes. All data were collected by trained staff using standardized protocols.
5. Statistical Analysis
During analysis of the data from the KNHNES, the following errors were corrected using complex sample design: inclusion errors due to differences in number of households and populations between sample design and survey periods, unequal selection probabilities, and non-response errors of those who did not participate in the survey. Primary sampling unit, k-strata, and weight were specified [11]. A complex sample analysis method was as follows:
First, frequency analysis was conducted to understand the general characteristics of the study participants. Second, analysis of variance (ANOVA) was performed on continuous variables, and chi-square test was performed on categorical variables to evaluate the relationship between coffee and green tea consumption and the general characteristics of the participants. When testing the differences between groups, a survey measurement procedure was used to calculate the number (%) of categorical variables. To compare serum ferritin and hemoglobin concentrations, the continuous variables were described as mean and 95% CI. Third, ANOVA and analysis of covariance were conducted to confirm the differences in hemoglobin and ferritin levels according to coffee and green tea consumption. Additionally, a post hoc analysis was performed to assess ferritin level changes according to coffee consumption. We used the Bonferroni correction for testing multiple comparisons. The Bonferroni correction was applied, resulting in a critical value of P<0.008 (critical P-value of 0.05/4C2). Fourth, a linear regression analysis was performed to verify whether coffee and green tea consumption affected the concentrations of blood hemoglobin and ferritin. Ferritin levels were skewed and log-transformed before the analysis. Two-sided P-values of <0.05 were considered statistically significant. All analyses were performed using IBM SPSS ver. 26.0 (IBM Corp., Armonk, NY, USA).
RESULTS
1. Baseline Characteristics
General characteristics of the participants are summarized in Table 1. Of the 4,322 study population, mean hemoglobin level was 12.90┬▒0.02 g/dL, and mean ferritin level was 31.95┬▒0.67 ng/mL. Mean coffee intake per day was 1.28┬▒0.02 cups, and mean green tea intake per day was 0.24┬▒0.01 cups. More than 60% of the study population drank coffee at least once per day. It was noted that among the green tea drinkers, 3,887 (90.1%) individuals drank <1 cup of green tea per day (Tables 2ŌĆō4). Participants with a higher coffee intake were more likely to have a higher BMI (P<0.05), alcohol consumption (P<0.001), and smoking status (P<0.05), together with a higher presence of hypertension (P<0.05).
2. Hemoglobin and Coffee or Green Tea
Table 5 presents the relationships between hemoglobin levels and daily coffee or green tea consumption. Hemoglobin level was higher among people who drink coffee or green tea less than once a day (13.16┬▒0.14 g/dL) than those who drink one (13.12┬▒0.14 g/dL) or two cups (13.07┬▒0.14 g/dL) of coffee per day. However, there was no significant association between serum hemoglobin levels and coffee consumption after adjusting for confounding variables (P=0.350).
Similarly, no significant correlation was found between hemoglobin levels and green tea consumption (P=0.072) (Table 5). After adjusting for potential confounders, the serum hemoglobin level increased with green tea intake. The mean serum hemoglobin level was 13.11┬▒0.14 g/dL with <1 green tea per day, 13.15┬▒0.15 g/dL with one green tea per day, and 13.43┬▒0.18 g/dL with two cups of green tea per day (P=0.107).
3. Ferritin and Coffee or Green Tea
Table 6 shows the association between ferritin levels and coffee and green tea intake. There was a significant association between ferritin levels and coffee intake (P=0.006). Ferritin level was higher among people who drink coffee less than once a day (33.03┬▒0.87 ng/mL) than those who drink two cups (29.60┬▒0.95 ng/mL) or more than three cups (29.42┬▒1.12 ng/mL) of coffee per day. After adjusting for covariates, the ferritin level decreased with coffee intake (P<0.001). At a Bonferroni critical P-value of <0.008, the ferritin level had significantly different mean concentrations between once a day and two cups per day in the adjusted models (P<0.001). Additionally, ferritin levels had significantly different mean concentrations between twice a day and three cups a day (P<0.001) and once a day and 3 times a day in the adjusted models (P<0.001).
Ferritin levels were not associated with green tea consumption after adjusting for potential confounders (P=0.409) (Table 6). Increased green tea consumption from less than once a day (34.51┬▒3.58 ng/mL) to more than three cups a day (41.81┬▒6.58 ng/mL) was found to be associated with increased serum ferritin level. Furthermore, we found a significant association between ferritin levels and total consumption of coffee and green tea (P=0.023) (Table 6).
4. Correlations between Coffee or Green Tea Intake Frequencies and Concentration of Blood Hemoglobin and Ferritin
The results of linear regression analyses of the associations between coffee or green tea consumption and hemoglobin levels are shown in Table 7. In the fully adjusted model, there was a significant association between coffee consumption and ferritin levels (╬▓=-2.09, P<0.001). There was a negative correlation between ferritin level and coffee intake; ferritin level decreased by 2.09 ng/mL with a one-cup increase in daily coffee consumption. Similarly, a negative correlation between ferritin concentration and the total consumption of daily coffee and green tea was found (╬▓=-1.15, P<0.05). No significant association was observed between green tea intake and the biochemical markers of iron status.
DISCUSSION
This study examined the association between factors indicating iron metabolism, such as ferritin and hemoglobin levels, and the consumption of coffee or green tea in Korean women before menopause. Because coffee consumption increased in Korean premenopausal women, ferritin, an indicator of IDA, was significantly low, and the association was even stronger after adjusting for covariates. Additionally, ferritin level decreased by 2.09 ng/mL with a 1-cup increase in daily coffee intake (╬▓=-2.09, P<0.001). An inverted J-shaped curvilinear relationship was observed between ferritin levels and coffee consumption. A study by Sung et al. [12] used the same KHANES survey data (2010ŌĆō2012), which indicated that as coffee consumption increased, serum ferritin levels decreased in Korean adult men and women aged Ōēź19 years (P for trend <0.001 and P for trend <0.001, respectively).
Previous studies showed that coffee intake affects the biological availability of iron [13]. Iron exists in food in both heme and non-heme forms. Heme is very well absorbed, while non-heme, which accounts for 90% of the total iron intake, has a low absorption rate, and absorption is affected significantly by other components. In particular, coffee and green tea intake reduces iron absorption in the non-heme form [14]. Childbearing women can develop anemia during menstruation, and pregnant women are at a high risk of developing anemia. Monthly menstruating women are at high risk of iron deficiency and anemia. Iron deficiency during pregnancy has been found to affect placental function and fetal outcomes. In rats, iron deficiency during pregnancy results in changes in lipid metabolism and obesity, high blood pressure, and enlarged hearts in the offspring, which might explain the increase in fetal malformations observed in pregnant females [15]. Therefore, according to the results of this study, education and guidance are needed to confirm that drinking coffee and green tea can inhibit iron absorption in premenopausal women with a high prevalence of IDA. Our results indicate that coffee may have practical implications in managing risk factors of anemia.
Previous studies on the relationship between coffee intake and anemia have reported that the risk of anemia increases with coffee consumption. According to the 1992 National Health and Nutrition Examination Survey II, an average daily intake of 3.7 cups of coffee and tea increased the occurrence of anemia (P<0.05) [16]. Similarly, spending >4 cups of coffee per day tripled the risk of anemia among Korean female workers (odds ratio, 2.93; 95% CI, 1.01ŌĆō8.49) [17]. However, in our study, coffee consumption was not associated with hemoglobin levels (P=0.35).
A post hoc test in this study indicated that the ferritin level significantly differed between the one and two cups, two and three cups, and three and one cup groups (overall P<0.001). This means that the level of ferritin changes after drinking >2 cups of coffee. Thus, consumption of >3 cups of coffee is expected to be important for trend testing, but this has not been investigated in the fifth KNHANES.
Additionally, brewing methods and additives have not been investigated. Coffee may undergo different physiological reactions, depending on the extraction method and additives in the body [18]. It is unclear whether the adverse effects of coffee on hemoglobin noted in our study are related to the type of coffee or additives, such as sugar, milk, or cream. This suggests that additives or type of coffee can affect hemoglobin levels; therefore, further research is needed.
According to a medical case report in Taiwan, a 48-year-old man presented with IDA. At first, the cause of his iron deficiency remained unexplained, but they eventually found that he consumed 1.5 L of green tea every day for 2 years. The patient was encouraged to abstain from drinking green tea and was prescribed iron supplements. After the restriction of green tea consumption, his hemoglobin levels became normal 2 months later [19]. This may explain why the inhibitory effects were predominantly facilitated by the marked iron-binding properties of phenolic compounds bearing catechol groups in green tea. However, our results from the KNHANES data did not indicate any significant correlation between green tea consumption and overall biochemical markers of iron deficiency. Our results differed from those of previous studies conducted among adults in China,19) United Kingdom [20], and France [21]. In a simple univariate analysis, Galan et al. [21] demonstrated a negative correlation between serum ferritin levels and tea consumption (r=-0.18, P<0.05) in a group of female French students. This can be explained by the difference in tea drinking habits that affected our results. Habitual tea consumption is less popular in Korea. In 2008, Koreans consumed only 100 g of green tea per year, compared with 3,000 g in the United Kingdom, 800 g in China, and 350 g in France [22]. These countries consume an average of 5ŌĆō7 cups of green tea daily. However, in this study, >90% of the participants consumed <1 cup of green tea per day, which was relatively very much lower than other countriesŌĆÖ tea consumption.
As the total intake of coffee and green tea increased, ferritin levels significantly decreased after adjustment for potential confounders (P=0.023). However, this may have been caused mainly by the effects of coffee consumption. In our study, the group that consumed <1 cup of green tea per day comprised 90% or more of the total, which was relatively much lower than coffee consumption.
This cross-sectional study has limitations. First, this is study did not reveal the exact causal relationship between beverage consumption and ferritin and hemoglobin levels. Second, since this studyŌĆÖs data are based on a questionnaire and 24-hour dietary recall, there is a difference from actual beverage consumption. Third, the amount of serum ferritin may vary, depending on menstruation, gynecological diseases, such as uterine myoma, and inflammatory disease; however, this was not reflected because there were no survey data. Fourth, we analyzed data collected between 2010ŌĆō2012 because ferritin levels were last investigated between 2010ŌĆō2012, and ferritin levels have not been included in survey items since then. To study the risk factors for IDA, further studies using an updated survey of factors indicating iron metabolism, such as ferritin iron and total iron-binding capacity, are needed. Despite these limitations, this study was a large-scale group study based on local communities, and there were many analysis subjects. It was easy to generalize and apply this study results using data from the Korea National and Nutrition Examination Survey, which implemented strict quality control [23]. Additionally, there was clinical significance in that the characteristics were subdivided and analyzed as premenopausal women. Further large-scale studies should be conducted to confirm the relationship between coffee and green tea consumption and anemia and to determine the cause. Regardless, our study suggests that coffee consumption is a possible risk factor for iron deficiency in Korean premenopausal women.
In conclusion, coffee intake is associated with low serum ferritin levels in premenopausal women. Serum hemoglobin levels were negatively associated with coffee intake, although the association was not statistically significant. Our results indicate that drinking >2 cups of coffee significantly affect ferritin levels in Korean premenopausal women.