INTRODUCTION
Regular fruit and vegetable intake has traditionally been regarded as a protective factor against chronic diseases [1]. Nevertheless, fruits as a whole have a wide range of glycemic indexes (GIs) raising the question of whether eating any sort of fruit still protects against chronic diseases [2]. Studies on carbohydrate quality and the risk of type 2 diabetes have consistently reported that higher dietary GIs and glycemic load (GLs) are associated with a greater risk of type 2 diabetes [3,4]. Among the myriad of factors known to be associated with type 2 diabetes mellitus, few studies have examined the consumption of fruits with high GIs (HGIs) as potential risk factors.
There are conflicting results regarding this issue. Some claim that eating diverse kinds of fruits protects against the risk of developing diabetes [5], while one group from Singapore reported that the intake of HGI fruits was associated with a greater risk of type 2 diabetes mellitus, but only among men [6]. No significant association was observed between the risk of type 2 diabetes mellitus and the GIs/GLs of various fruits, in three prospective cohort studies of US adults [7]. That group also found that the proportion of total daily GL from fruit intake was typically <10%, let alone <4% for the most commonly eaten fruits [7], which makes research on fruit intake challenging.
In this study, changes in fruit consumption and the incidence of type 2 diabetes were tracked in the Korean Genome and Epidemiology Health Examinee Study (KoGES-HEXA) cohort. Twelve different fruits and their consumption levels were recorded. Various combinations (high, middle, low) were analyzed in terms of their unique GI and GL values.
METHODS
1. Study Population
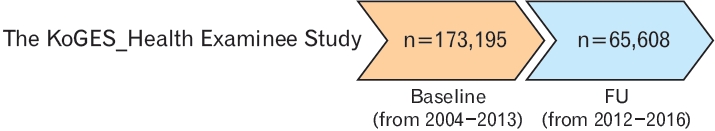
The Korean Genome and Epidemiology Study (KoGES) is a comprehensive cohort-based survey study, designed and run by the Korea Disease Control and Prevention Agency (formerly, Korea Centers for Disease Control and Prevention). The information collected includes dietary, environmental, socio-economical, and lifestyle factors, and chronic diseases. The study subjects (men and women, aged 40–69 years at baseline) consist of community dwellers and participants recruited from the national health examinee registry [8]. Of the three different population-based cohorts, the KoGES-HEXA was the one used for this study. The KoGES-HEXA cohort consists of city-dwellers who undergo regular health checkups, and comprises 64,085 males and 109,110 females.
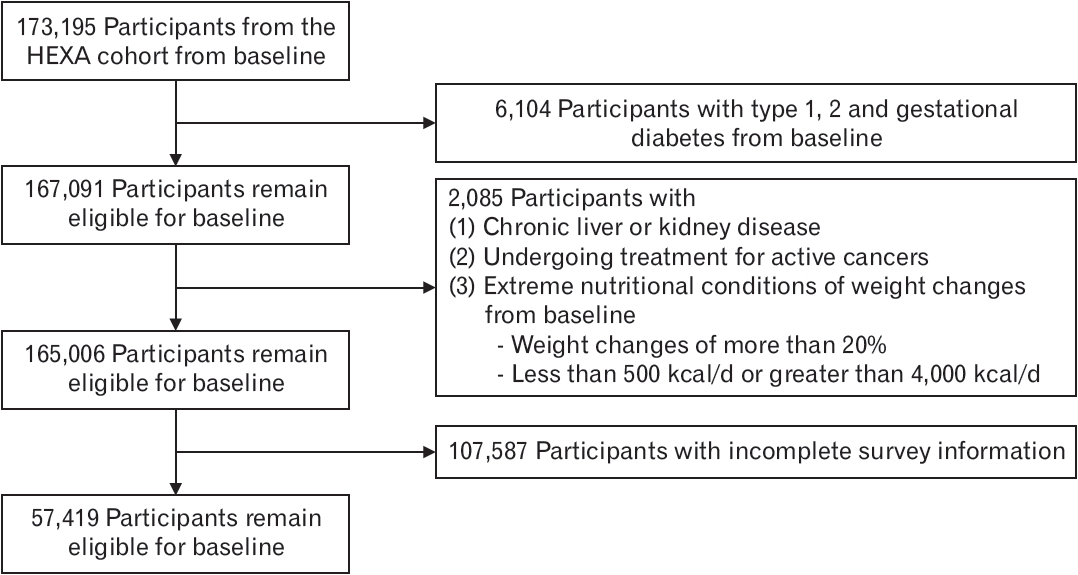
To minimize the effect of potential confounders, participants with the following conditions (at baseline and follow-up) were excluded from our analysis: those already diagnosed with (1) type 1, 2, or gestational diabetes, (2) chronic kidney disease, or (3) chronic liver disease; those undergoing treatment for active cancers; those falling under extreme nutritional conditions (<500 kcal per day or >4,000 kcal per day); those with extreme weight changes (>±20% change in weight during follow-up); and those with incomplete survey information regarding the above-listed factors. In total, 57,419 of the initial 173,195 participants were included in this study (Figure 1). A follow-up rate of 35.8% was achieved, accounting for 337,574.7 person-years. The average follow-up period was 53.5 months (range, 11–145 months). The study protocol was approved by the Institutional Review Board of Seoul National University Hospital, Seoul, Korea (approval no., E-2206-106- 1333). All participants provided had written informed consent before participating in the study.
2. Dietary Assessment: Food Frequency Questionnaire
For dietary assessment, a semi-quantitative food frequency questionnaire (FFQ) involving 103 items (later expanded to 106) was developed for the KoGES [8]. The participants were asked how often and how much they consumed each food, on average, over the preceding year. For frequencies, participants could choose from nine different responses, with “1” being never and “9” being 3 times per day. For average intakes, three different portions (small/medium/large, in grams) were given as choices. The medium portion was set to one serving size for each food item, based on the average intake of Koreans aged 40–69. Validation of the questionnaire was done between 2002–2004, where dietary records were collected for 3 days during each of the four seasons, from 124 participants who attended the health examination center [9].
The FFQs were obtained from the baseline (2004–2013) and the first follow-up (2012–2016). Follow-up intervals varied between the participants. A schematic of the cohorts’ follow-up schedules is depicted in Figure 2.
The GIs and GLs of each food item were based on previous studies on commonly consumed foods, with glucose used as a reference GI of 100 [2,10,11]. For duplicate values of GIs, the one derived from Korean foods was selected. For multiple food items per question, the average values were calculated. Carbohydrate contents were taken from the food database of the Korean Ministry of Food and Drug Safety (https://various.foodsafetykorea.go.kr/nutrient/). The 12 types of fruits included in the KoGES FFQ are as follows (as per the codebook order): strawberries, oriental melons or melons, watermelons, peaches or plums, bananas, persimmons or dried persimmons, tangerines, pears, apples, oranges, grapes, and tomatoes. The latter five fruits (pears, apples, oranges, grapes, and tomatoes) were accepted as valid consumptions for both raw and juiced forms. Among the 12 fruits, Korean melon/melons, watermelons, and bananas have the highest GIs, of 62–80, and were thus classified as HGI fruits. Grapes, tangerines, and persimmons/dried persimmons were classified as medium GI fruits (41–50). Apples, oranges, strawberries, peaches or plums, tomatoes, and pears (15–40) were classified as low GI fruits. The fruits were also classified using GL values [12]. Grapes, bananas, oranges, and watermelons were classified as high GL fruits (11.2–13.6). Persimmons/dried persimmons, and melons/oriental melons were classified as medium GL fruits (6.7–10.3). Tomatoes, peaches or plums, apples, pears, strawberries, and tangerines were classified as low GL fruits (1.3–5.1). A complete list of fruit items and relevant information is shown in Supplement 1 [2,13].
3. Covariates
In the KoGES-HEXA cohort, anthropometric and lifestyle information have been updated at each follow-up. The factors considered relevant to type 2 diabetes risk in the study are age, sex, initial body mass index (BMI), total caloric intake, cigarette smoking status, physical activity status, family history of diabetes, physician-diagnosed hypertension/dyslipidemia, and income level. Initial BMI values were obtained by measuring each participant’s initial weight (in kilograms) and dividing it by the square of his/her height (in meters). Cigarette smoking status was recorded from initial assessments and categorized as non-smoker, former, and current. Physical activity status was assessed via hours per day of moderate-to-vigorous aerobic exercise, and cumulative average values were taken. Income level was categorized into quartiles (1: <1 million Korean won [KRW]/mo; 2: from 1 to <2 million KRW/mo; 3: from 2 to <4 million KRW/mo; 4: ≥4 million KRW/mo), and values were taken from the initial assessments.
4. Ascertainment of Type 2 Diabetes
Participants were asked about the incidence of physician-diagnosed diabetes in the baseline and follow-up questionnaires. In addition to self-reported surveys, laboratory analyses were done as follows: (1) fasting glucose levels for all participants in the baseline (2004–2013) and follow-up (2012–2016 periods); (2) glycated hemoglobin levels for the baseline participant subset, as well as for all participants in the follow-up. The diagnosis was confirmed if at least one of the following was matched: (1) the diagnosis was confirmed by a physician; (2) the participant was treated with insulin or oral hypoglycemic medication; (3) the participant had a fasting glucose concentration of ≥126 mg/dL on two separate occasions; (4) the participant had a glycated hemoglobin level of ≥6.5 % according to the 2019 Korean Diabetes Association [12].
5. Statistical Analyses
The participants’ person-years were measured from their dates of initial enrollment until their diagnoses of type 2 diabetes or the latest follow-up. Reasons for loss to follow-up (e.g., death, accidents, and others) were classified. The analysis was stratified by sex. Multivariable cubic regression models were used to estimate hazard ratios (HRs) and 95% confidence intervals (CIs).
For continuous variables, means and standard deviations were used. Categorical variables were expressed as numbers and percentages. The differences in basic characteristics were analyzed using the chi-square test for categorical variables, and one-way analysis of variance for continuous variables.
The associations between fruit intake and the subsequent risk of developing type 2 diabetes were assessed for three different fruit combinations: first, using total fruit intake as the main variable; second, grouped by GI (high, medium, low); and third, grouped by GL (high, medium, low). The fruit intakes were measured as cumulative averages, in servings per week. Linear regression models were adjusted for potential confounding factors such as age, family history of diabetes (yes or no), baseline BMI (<20.0, 20.0–23.9, 24.0–27.9, ≥28.0 kg/m2), baseline physical activity (>120 min/wk, 120–180 min/wk, >180 min/wk of moderate to high intensity), initial smoking status, income level (in quartiles), medical history of hypertension (yes/no), and hypercholesterolemia (yes/no). Changes in total caloric intake were added to the above adjustments.
Subgroup analyses by (1) age (40–54.9 years and 55–70 years), (2) sex (male and female), (3) initial BMI (16.0–19.9, 20–24.9, ≥25 kg/m2), and (4) income level (<1 million KRW/mo; 1–1.99 million KRW/mo; 2–4 million KRW/mo; >4 millioin KRW/mo) were done using the same target variables and methods.
Missing variables were replaced with carried-forward values for continuous variables, and a missing indicator was added for categorical variables to minimize bias due to missing values.
The results were considered significant for P-values of <0.05. All Pvalues were two-sided. All data analyses were performed using the R language, an open-source library commonly used for statistical purposes (The R Foundation for Statistical Computing, Vienna, Austria).
RESULTS
A total of 2,549 incident cases of type 2 diabetes were documented over 283,033.8 person-years of follow-up. The baseline characteristics of the study participants are presented across percentage changes in total fruit intakes (Table 1). Total fruit consumption was negatively correlated with age, BMI, and current smoking and drinking status, but positively correlated with income level, physical activity, and total energy intake. Females were more likely than males to consume more fruits.
Total whole fruit consumption was not associated with a lower risk of type 2 diabetes: the HR (95% CI) of type 2 diabetes for one serving per week increment of whole fruit consumption was 1.02 (95% CI. 0.99–1.06; P=0.2) (Table 2). Before adjusting for personal and other lifestyle factors, tangerines (HR, 0.93; 95% CI, 0.89–0.97; P<0.001), apples (HR, 0.95; 95% CI, 0.91–0.99; P=0.014), grapes (HR, 0.87; 95% CI, 0.82–0.93; P<0.001), and bananas (HR, 0.94; 95% CI, 0.89–0.99; P=0.028) showed significant associations with a reduced risk in our adjusted model. After the adjustment, only two of the four fruits remained negatively associated with the risk of type 2 diabetes (grapes [HR, 0.9; 95% CI, 0.84–0.96; P<0.001] and bananas [HR, 0.94; 95% CI, 0.88–1.00; P=0.039]). The negative associations for tangerines and apples were no longer statistically significant after multivariable adjustments of the above-mentioned covariates.
No associations were found between fruit consumption and the risk of type 2 diabetes according to the GI/GL values of the fruits (Table 3) [2,13].
Subgroup analyses were performed by (1) age, (2) sex, (3) initial BMI, and (4) income level (Supplements 2–5). Negative associations were found for grapes (HR, 0.85; 95% CI, 0.78–0.93; P<0.001), apples (HR, 0.93; 95% CI, 0.88–0.99; P=0.025), and persimmons (HR, 0.92; 95% CI, 0.86–0.99; P=0.030) in the older group, but not in the younger group (Supplement 2). In the younger group, middle GL fruits (melons/oriental melons, persimmons/dried persimmons) showed positive associations (HR, 1.07; 95% CI, 1.01–1.13; P=0.033). In the male group, bananas were found to be significant (HR, 0.88; 95% CI, 0.79–0.99; P=0.030). In the female group, however, grapes had a significant negative association (HR, 0.90; 95% CI, 0.84–0.98; P=0.010) (Supplement 3). No associations were found in the lowest initial BMI group. Grapes were found to have negative associations in the middle (HR, 0.88; 95% CI, 0.80–0.97; P=0.009) and highest BMI groups (HR, 0.91; 95% CI, 0.84–0.99; P=0.031) (Supplement 4). The lowest income quartile did not show any associations between fruits and type 2 diabetes. The second income quartile showed strong associations for tangerines (HR, 0.88; 95% CI, 0.79–0.98; P=0.016), pears (HR, 0.83; 95% CI, 0.72–0.95; P=0.009), apples (HR, 0.87; 95% CI, 0.79–0.96; P=0.007), and grapes (HR, 0.78; 95% CI, 0.67–0.91; P=0.002). Fruits in the middle GL were associated with a mild increase in HR (1.13; 95% CI, 1.02–1.25; P=0.017). The third income quartile showed an association for grapes (HR, 0.88; 95% CI, 0.79–0.98; P=0.024), high GL fruits (HR, 0.91; 95% CI, 0.86–0.96; P=0.001), and high GI fruits (HR, 1.08; 95% CI, 1.01–1.16; P=0.025). The fourth income quartile did not have any significant associations between fruit intake and type 2 diabetes (Supplement 5).
DISCUSSION
A previous study using the KoGES Ansan and Ansung (KoGES-AS) cohort reported that the risk of type 2 diabetes may be amplified with increasing dietary GL load [14]. In the KoGES-HEXA cohort, however, neither dietary GL load nor the GIs of the fruits we studied were associated with the risk of developing type 2 diabetes. Among individual fruit types, only a few showed any associations. Greater consumption levels of grapes and bananas were significantly associated with a reduced risk of type 2 diabetes. These associations were consistent with the study results of Muraki et al. [7] on the Nurses’ Health Study (NHS) I and NHS II cohorts, where greater consumption levels of grapes, raisins, and bananas had significant impacts. Greater fruit juice consumption may be associated with an increased risk, but the FFQs used in this study did not differentiate between whole fruits or processed forms.
In our subgroup analysis, several findings are worth noting. First, due to the small incidence of diabetes in the younger age group, statistical significance in terms of fruit consumption appeared only in the older group. Second, males and females had different fruit correlation profiles. Both bananas and grapes were reported to have negative relationships with the risk of diabetes [7]. We might hypothesize that the polyphenol content of grapes and the potassium content of bananas may exert different effects on glucose metabolism between males and females [15]. Third, the first and fourth income quartiles did not show significant associations with any fruit type. The first income quartile consumed fewer fruits on average than the fourth quartile (Table 1), so the effect may have simply been too small to be noticeable. The fourth income quartile had the largest daily caloric intake. Glucose metabolism may therefore have been affected by the intake of other foods, as the caloric intake from fruits becomes proportionally smaller. Fourth, a disparity was observed between the high GI and GL groups in the third income quartile (Supplement 5). Specifically, high GL fruits (HR, 0.91; 95% CI, 0.86–0.96; P=0.001) showed a negative correlation, while high GI fruits (HR, 1.08; 95% CI, 1.01–1.16; P=0.025) had a positive correlation. This may be because grapes, which contributed significantly to the negative correlation, were included in the high GL group but not in the high GI one. Another possible explanation for this may be that the GLs or GIs of fruits do not have uniform and significant impacts on glucose metabolism.
Overall, it would be prudent to find out whether the trends we observed in the KoGES-HEXA cohort hold true in the KoGES-AS and KoGES-Cardiovascular Disease Association Study (KoGES-CAVAS) cohorts as well.
Of the dietary studies in South Korea using FFQs, the KoGES cohort has the highest number of participants. Historically, due to their regular follow-up schedules and limited number of follow-up FFQs, dietary studies in South Korea have only been done on KoGES subgroups (e.g., KoGES-AS and KoGES-CAVAS) [16,17]. This study made a similar attempt to analyze KoGES-HEXA data.
The limitations of this study are as follows. First, measuring the time-varying effect of the consumption of different fruits was omitted [18]. Many prospective dietary cohort studies focus on the incident rates of chronic diseases and baseline measures or cumulative averages of dietary variables [7,19]. Baseline or average dietary measures have the advantage that their results are more intuitive and easier to interpret. Meanwhile, cohort studies usually have follow-up periods of >5 years; and, in particular, the KoGES study has follow-up periods of up to 15 years. Since intra-personal variability can hinder the accurate estimation of usual intake [20], problems can arise for large cohort studies with long follow-up periods. With the koGES-HEXA cohort, only one round of follow-up FFQs was administered. Thus, it was impossible to measure the time-varying effect of changing levels of fruit consumption. Second, individual participants in the cohort have had different follow-up intervals. Adjustment using follow-up duration was attempted, but it did not change the results significantly. Third, the FFQ contained only 106 food items, only 12 of which concerned fruits. Similar fruits were grouped together (e.g., muskmelons/melons, peaches/plums, persimmons/dried persimmons). This, however, is an inherent limitation of the FFQ itself. Similarly, for five of the 12 fruit items (pears, apples, oranges, grapes, and tomatoes) no differentiation was done between fruit juices and whole fruits. For a better and more comprehensive understanding of how fruits impact glucose metabolism, fruit-specific cohorts, and survey forms would be warranted. Fourth, the follow-up rate was generally low. After applying the exclusion criteria, only 34.2% of the participants remained eligible for follow-up analysis. The baseline characteristics of the lost-to-follow-up group can be seen in Supplement 6. Notably, 72,691 of the 109,110 participants (66.7%) belonged to the lowest quartile of fruit consumption—a ratio that was much greater than the similar ratio in the follow-up group (20.9%). With greater fruit consumption, the same trends were also observed in the lost-to-follow-up group as in the follow-up group—including decreasing trends in smoking and drinking rates, decreasing BMI ratios, increasing monthly income, and a higher ratio of females. In 2016, changes in dietary patterns and corresponding rates of type 2 diabetes incidence were assessed [21]. With the reassessment of overall dietary quality and new onset rates of type 2 diabetes every 4 years, the risk has been negatively associated with overall dietary quality.