Dietary Habits of Newly Diagnosed Patients with Breast Cancer in Korea
Article information

Abstract
Background
In patients with breast cancer, a healthy diet can help reduce breast cancer-specific recurrence, mortality, and comorbid chronic disease rates. There have been few studies on dietary habits immediately after breast cancer diagnosis, especially those involving the Asian population. Therefore, this study aimed to compare the nutritional habits of newly diagnosed patients with breast cancer and the general population without cancer in Korea using propensity score (PS) matching.
Methods
We conducted a case-controlled study of 157 patients with breast cancer and 2,363 cancer-free control participants from the Korea National Health and Nutrition Examination Survey. The PS values for the predicted probability of patients with breast cancer and the general population were estimated using logistic regression analysis, including age and body mass index. The dietary patterns were assessed using a 24-hour recall of 1 day and the Food Frequency Questionnaire.
Results
PS matching showed that patients with breast cancer consumed fewer calories and carbohydrates; however, they consumed more protein and fat compared to the general population. Compared to the general population, patients with breast cancer consumed more healthy foods such as fish, seaweed, vegetables, fruit, mixed-grain rice, and nuts; however, they also consumed more soup, stew, and red meat.
Conclusion
Newly diagnosed patients with breast cancer have some healthy dietary habits compared to the general population. However, there is considerable room for improvement in their diet quality. Our results support the need to develop tailored dietary recommendations for patients with breast cancer during the diagnostic and posttreatment periods to improve their diet quality.
INTRODUCTION
Breast cancer is the most prevalent cancer among female patients worldwide [1]. Although its prevalence rate has been high mainly in developed countries, it is also gradually increasing in developing countries; this is thought to be caused by westernized eating habits [2]. In Korea, the prevalence of breast cancer has steadily increased during the past 20 years and is currently the most prevalent cancer among female patients [3]. Therefore, early diagnostic procedures and treatments have been developed, resulting in the 5-year breast cancer survival rate in Korea continuously increasing from 79.2% (1993–1995) to 93.2% (2013–2017) [4]. Recently, maintaining the quality of life after cancer diagnosis and managing complications have been the focus of interest among researchers [5]. Studies have shown that consuming a healthy diet increases survival rates, reduces side effects of chemotherapy, and reduces breast cancer recurrence rates [6,7]. Therefore, physicians recommend that patients diagnosed with breast cancer should improve their dietary habits; furthermore, several studies have confirmed that these improvements are associated with changes in dietary habits after breast cancer diagnosis [8,9]. However, there have been few studies on dietary habits immediately after breast cancer diagnosis, especially those involving the Asian population. Therefore, this study aimed to compare the dietary habits of newly diagnosed patients with breast cancer and the general population without cancer in Korea using propensity score (PS) matching.
METHODS
1. Study Population
This study included adult patients (19 years of age or older) with newly diagnosed breast cancer at Severance Hospital and Gangnam Severance Hospital in Korea between December 2016 and February 2019. Patients with breast cancer recurrence were excluded. A total of 157 female patients with breast cancer were included. To compare the nutrition intake and dietary habits of patients with breast cancer and the general population without cancer, we obtained data from the Korea National Health and Nutrition Examination Survey (KNHANES) 2016. The KNHANES is a nationwide, cross-sectional study that annually monitors the health and nutritional status of the Korean population. Among 8,150 participants in the KNHANES 2016, we excluded those younger than 19 years of age (n=1,768), male participants (n=2,765), those with a history of cancer (n=447), and those with insufficient data (n=807). The remaining 2,363 participants were age- and body mass index (BMI)-matched to patients with breast cancer using a 1:1 ratio. Finally, 157 patients with breast cancer and 157 cancer-free control participants were analyzed. A flow chart of the study population selection process is described in Figure 1. Informed consent was obtained from all participants in accordance with the Declaration of Helsinki guidelines. The study protocol was approved by the Institutional Review Board of Severance Hospital and Gangnam Severance Hospital (IRB no., 4-2016-0859).

Flow chart of the study population. KNHANES, Korea National Health and Nutrition Examination Survey; PS, propensity score; BMI, body mass index.
2. Anthropometric and Clinical Measurements
We standardized the investigation of patients with breast cancer using the KNHANES procedures. A detailed description of the study procedures is provided elsewhere (https://knhanes.cdc.go.kr/knhanes). Standard procedures were performed by well-trained examiners. The BMI was calculated as weight (kg) divided by height squared (m2). The waist circumference was measured at the midpoint between the iliac crest and costal margin. Systolic blood pressure (SBP), diastolic blood pressure, and heart rate were measured a total of 3 times, and the average of the last two values was recorded. After midnight fasting, blood tests were performed to obtain the fasting glucose, triglyceride (TG), total cholesterol, and high-density lipoprotein (HDL) cholesterol levels; the results were analyzed using a Hitachi 700-110 Chemistry Analyzer (Hitachi Co., Tokyo, Japan). Low-density lipoprotein cholesterol was calculated using the Friedewald equation. Smoking and alcohol consumption habits were obtained from a self-reported questionnaire. We defined a current smoker as one who currently smokes and has smoked more than 100 cigarettes. A current drinker was defined as one who drinks at least one alcoholic beverage each month. The Global Physical Activity Questionnaire (GPAQ) was used to assess the physical activity level. The GPAQ score was quantified to the corresponding metabolic equivalent of task (MET) minutes per week. Quantification was calculated as follows: each physical activity level×body activity time (minutes)×number of activities per week; 8.0 METs applied to high-intensity activities and 4.0 METs applied to moderate-intensity activities [10]. The Patient Health Questionnaire-9 (PHQ-9) is a questionnaire used to screen for depression and was used to assess the severity of depression symptoms. The higher the score, the worse the depression severity; a score of more than 10 points indicates moderate depression [11]. The EuroQol-5 dimensions (EQ-5D) questionnaire, which measures the quality of life through a valuation set, was used to assess the health-related quality of life [12]. The EQ-5D comprises five items, motility, self-care, daily activity, pain/discomfort, and anxiety/depression, and low scores (range, 0–1) indicate poor quality of life. A score of 1 is considered the perfect health condition. The hormone receptor status, TNM (tumor-node-metastasis) stage, and comorbidity data of patients with breast cancer were collected by reviewing the electronic medical records.
3. Definition of Metabolic Syndrome
Metabolic syndrome and its risk factors were defined according to the modified criteria of the National Cholesterol Education Program Adult Treatment Panel III ethnicity-specific guidelines [13]. A participant with three or more of the following five components was defined as having metabolic syndrome: high blood pressure, defined as an SBP ≥130 mm Hg or diastolic blood pressure ≥85 mm Hg or current treatment for hypertension; high fasting glucose, defined as glucose ≥100 mg/dL or current treatment for diabetes; low HDL cholesterol, defined as HDL <50 mg/dL for female patients; high TG level, defined as TG ≥150 mg/dL; and abdominal obesity, defined as waist circumference ≥80 cm for female patients.
4. Dietary Assessment
We surveyed the dietary intake using a face-to-face interview. Dietary assessments consisted of 24-hour recall of 1 day and a qualitative Food Frequency Questionnaire (FFQ) for the previous year. The 24-hour recall method was used to assess the daily nutrient intake. Participants recalled the type and amount of all foods they had consumed the day before the interview, including snacks and beverages. Can-Pro 5.0 (nutrient intake assessment software developed by the Korean Nutrition Society, Seoul, Korea) was used to calculate nutrient intake. We calculated the energy intake percentage using macronutrients such as carbohydrates, protein, and fat as follows: carbohydrates (%)=carbohydrates (g)×4 kcal/total energy intake (kcal); protein (%)=protein (g)×4 kcal/total energy intake (kcal); total fat (%)=fat (g)×9 kcal/total energy intake (kcal); saturated fat (%)=saturated fat (g)×9 kcal/total energy intake (kcal); and unsaturated fat (%)=unsaturated fat (g)×9 kcal/total energy intake (kcal). The polyunsaturated fatty acid (PUFA)/saturated fatty acid (SFA), PUFA+monounsaturated fatty acid (MUFA)/SFA, omega-6 PUFA/omega-3 PUFA, and sodium/potassium ratios were also calculated to evaluate the diet quality. A validated, semiquantitative FFQ was used to collect the weekly intake of each food group [14]. The FFQ comprises 112 commonly consumed food items in Korea grouped as follows: rice, noodles, dumplings, breads, and rice cakes; soups and stews; soybeans, eggs, meat, and fish; vegetables and seaweed; potatoes; milk and dairy products; fruits; beverages; snacks; nuts; and alcoholic beverages. We additionally analyzed red meat, white meat, and mixed-grain rice. The frequency of the FFQ items was classified into nine categories (never or seldom; 1 time/mo; 2–3 times/mo; 1 time/wk; 2–4 times/wk; 5–6 times/wk; 1 time/d; 2 times/d; and 3 times/d). According to the FFQ results, the weekly consumption (times/wk) was calculated for each food.
5. Statistical Analysis
All statistical analyses were conducted using IBM SPSS ver. 23.0 statistical software (IBM Corp., Armonk, NY, USA). The PS for the predicted probability of patients with breast cancer was estimated using the logistic regression model, including age and BMI. Patients with breast cancer were matched to the cancer-free population in a 1:1 manner using a nearest-neighbor matching method with a greedy algorithm [15]. All statistical tests were two-sided, and statistical significance was set at P<0.05. The matched demographic characteristics were compared using the independent samples t-test for continuous variables or McNemar’s test for categorical variables. After adjusting for the total energy intake, we applied an analysis of covariance to compare the intake of nutrients and each food group.
RESULTS
Table 1 shows the clinical characteristics of the patients with breast cancer (n=157) and control participants (n=2,363) before PS matching and those of the control participants (n=157) after PS matching. Before matching, the BMI values of the patients with breast cancer and the control participants were 22.8±0.2 kg/m2 and 23.6±3.6 kg/m2, respectively (significantly different; P=0.001). Patients with breast cancer had significantly higher SBP, diastolic blood pressure, heart rate, and HDL cholesterol than control participants. The total GPAQ and PHQ-9 scores of the patients with breast cancer were also significantly higher than those of the control participants. Patients with breast cancer had significantly lower TG levels and EQ-5D scores than control participants. Additionally, patients with breast cancer had a significantly lower prevalence of dyslipidemia than control participants.
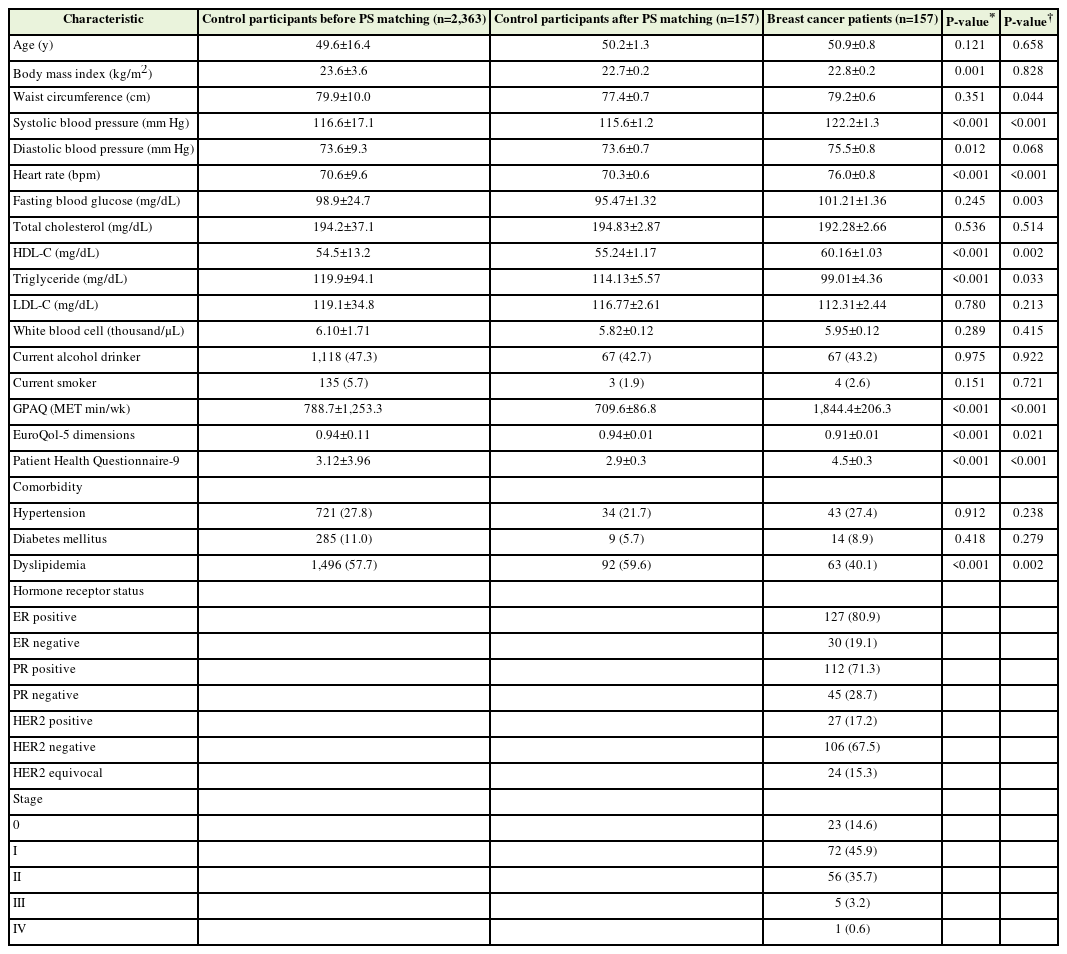
Clinical characteristics of control participants and patients with breast cancer
After 1:1 PS matching for age and BMI, the patients with breast had significantly higher waist circumferences, SBP, heart rates, fasting glucose, HDL cholesterol, and GPAQ and PHQ-9 scores compared to the control participants. However, patients with breast cancer had significantly lower TG levels and EQ-5D scores than control participants. Additionally, patients with breast cancer had a significantly lower prevalence of dyslipidemia than control participants.
Table 2 shows the daily nutrient intake of control participants and patients with breast cancer obtained using the 24-hour recall method after PS matching. The daily nutrient intake obtained using the 24-hour recall method before PS matching is presented in Supplement 1. The energy intake values were 1,551.60±39.29 kcal/d and 1,730.56±56.85 kcal/d for patients with breast cancer and control participants, respectively (P=0.01). Patients with breast cancer consumed more protein and fat and fewer carbohydrates than control participants (P<0.001). In addition, patients with breast cancer consumed significantly more MUFAs, PUFAs, cholesterol, dietary fiber, and sodium than control participants. Additionally, patients with breast cancer consumed significantly less omega-3 PUFAs and omega-6 PUFAs than control participants. The PUFA/SFA, PUFA+MUFA/SFA, omega-6 PUFA/omega-3 PUFA, and sodium/potassium ratios of patients with breast cancer were significantly higher than those of control participants.
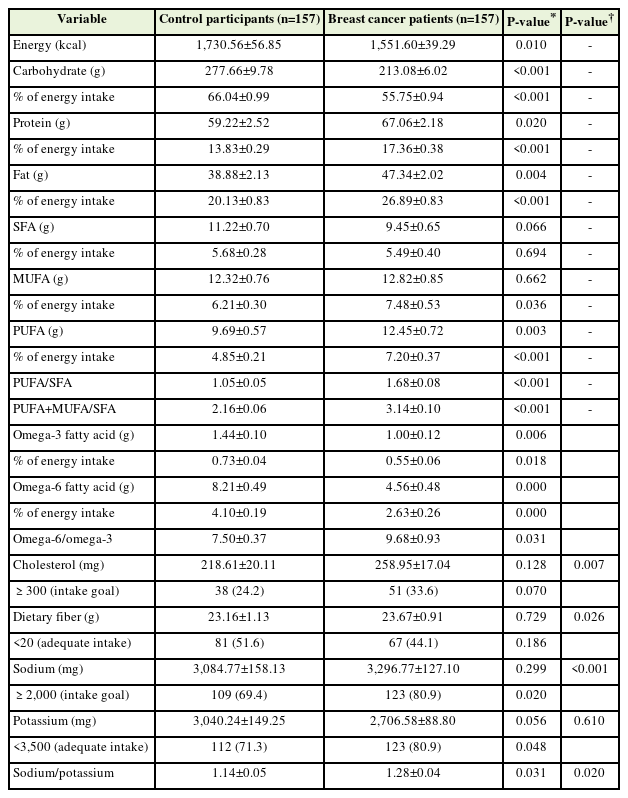
Daily nutrient intake of control participants and patients with breast cancer assessed using the 24-hour recall method
The frequencies of each food group of the control participants and patients with breast cancer after PS matching are shown in Table 3. The frequencies of each food group of the control participants and patients with breast cancer before PS matching are shown in Supplement 2. Because the energy intake values of control participants (1,704.58±56.84) and patients with breast cancer (2,015.86±107.37) estimated using the FFQ were significantly different (P=0.011), their nutrient intake values were adjusted for energy. Patients with breast cancer consumed significantly less mixed-grain rice than control participants (P=0.028). Additionally, patients with breast cancer consumed significantly more soup and stew (P=0.005), soybeans (P=0.007), eggs (P<0.001), red meat (P<0.001), fish and seafood (P=0.024), vegetables (P<0.001), seaweed (P=0.014), potatoes (P=0.002), fruits (P<0.001), and nuts (P=0.001) than control participants.
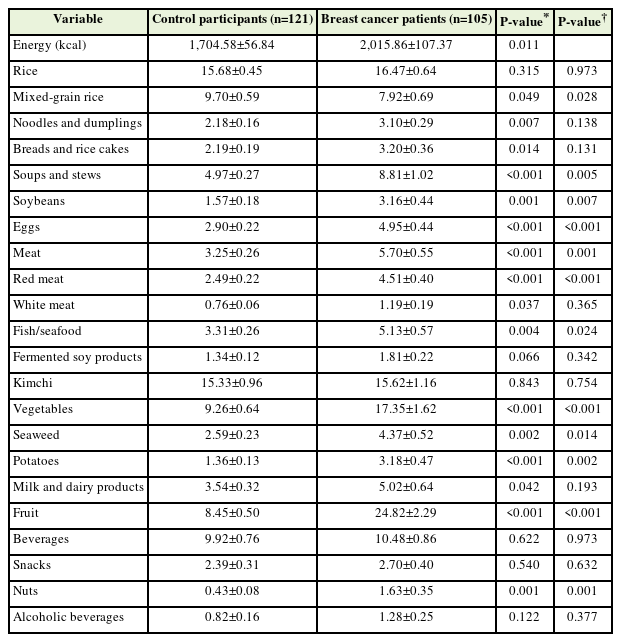
Weekly food group frequency of control participants and patients with breast cancer
Figure 2 shows the prevalence of metabolic syndrome and its components. The prevalence rates of metabolic syndrome were 22.9% among patients with breast cancer and 29.3% among control participants (no significant difference). Significantly higher prevalence rates of high blood pressure and fasting glucose were observed among patients with breast cancer than among control participants; however, the prevalence rates of low HDL cholesterol and high TG levels were significantly lower among patients with breast cancer.
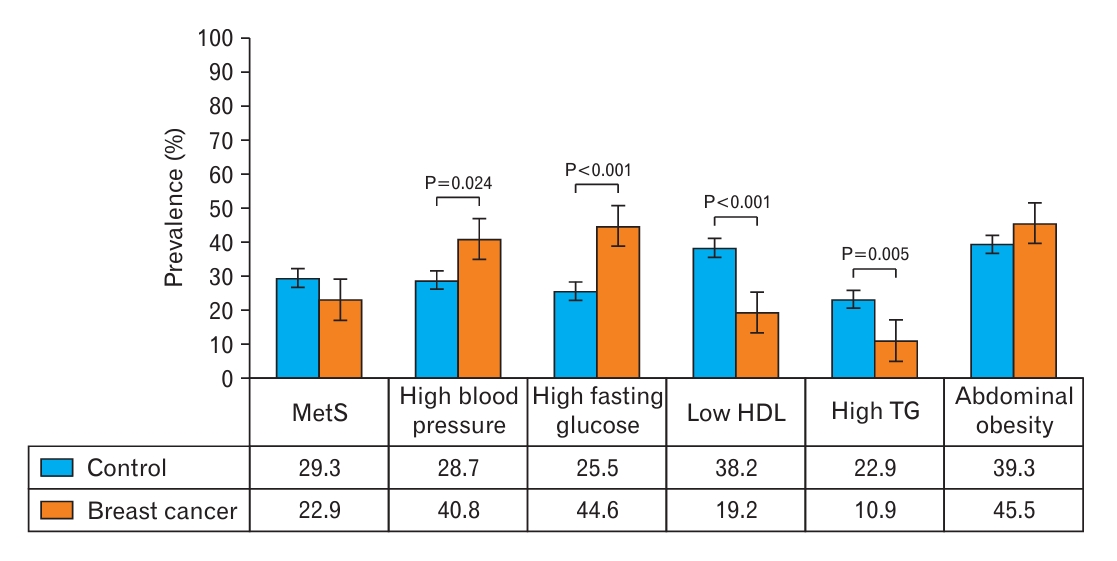
Metabolic syndrome and its components among the control participants and patients with breast cancer. MetS, metabolic syndrome; HDL, high-density lipoprotein; TG, triglyceride.
DISCUSSION
During this study, we compared the dietary habits of newly diagnosed patients with breast cancer and the general population without cancer using PS matching. Compared to the general population, patients with breast cancer had positive eating patterns, consumed less calories and carbohydrates, and consumed more unsaturated fatty acids, vegetables, fruit, seaweed, and nuts; however, there are some dietary habits that require improvement. Their omega-3 intake was insufficient, and their intake of the omega-6 to omega-3 ratio and red meat was high. Moreover, patients with breast cancer had a higher sodium intake and a higher sodium/potassium intake ratio than the general population. Long-term breast cancer survival is common, with 5-year relative survival rates of approximately 90%; furthermore, healthy lifestyles have an important role in breast cancer prognosis [16,17]. Post-diagnostic changes in dietary habits can help reduce breast cancer-specific recurrence and mortality rates. Compared to the general population, cancer survivors are at increased risk for second primary cancers and comorbid chronic diseases such as cardiovascular disease, diabetes, osteoporosis, and dementia; therefore, healthy eating patterns remain important for breast cancer survivors because they reduce the risk of secondary cancer and chronic diseases [18]. The World Cancer Research Fund International recommends that cancer survivors should adhere to the following dietary recommendations: eat mostly plant-based foods; limit the intake of red meat, alcoholic beverages, energy-dense foods, and salt; and avoid processed meat and high-sugar beverages [19]. Many patients with cancer are motivated to change their dietary habits after diagnosis because they believe these changes will help them control their disease [20]. The most commonly reported dietary changes of patients with cancer were the increased consumption of fruit and vegetables, followed by eating less red meat and less fat [9]. The patients with breast cancer in our study ate more fruit and vegetables than the general population. Fruit and vegetables are important sources of antioxidants and have beneficial effects on cancer-related biological pathways, including carcinogen bioactivation, cell signaling, cell-cycle regulation, and inflammation [21]. Furthermore, compared to the general population, the patients with breast cancer in this study more frequently ate seaweed, which may have beneficial effects that stem from its high fiber and mineral contents. Dietary fiber reduces the risk of breast cancer, likely by decreasing the level of estrogen in the blood circulation [22]. Epidemiological studies have demonstrated that dietary fiber is associated with a significant dose-response relationship for the risk of breast cancer [23].
The patients with breast cancer in this study had a higher intake of MUFA and PUFA than the general population; however, their intake of omega-3 fatty acids was insufficient, and their intake of omega-6/omega-3 fatty acids ratio was high. Some evidence suggests that omega-3 fatty acids may have a protective effect against breast cancer, whereas high levels of omega-6 fatty acids may increase the risk of breast cancer. Omega-3 fatty acids, which are found in fish and nuts, have anti-inflammatory properties that may help slow the growth and spread of breast cancer cells. However, high levels of omega-6 fatty acids, which are found in vegetable oils, may promote the growth of cancer cells [24,25]. The ideal omega-3/omega-6 fatty acids ratio for breast cancer prevention is not well-established; however, a lower omega-6/omega-3 fatty acids ratio is generally considered beneficial. More research is necessary to fully understand the relationship between these fatty acids and breast cancer.
Red meat consumption is generally thought to increase the risk of invasive breast cancer, whereas poultry consumption may be associated with reduced risk [25]. Women who ate more red meat during adolescence or early adulthood were at increased risk for the late development of breast cancer [26]. Therefore, patients with breast cancer should reduce their red meat intake. Regarding the relationship between dietary cholesterol and breast cancer development, conflicting and sometimes contradictory results have been observed, thus indicating that biological differences in cholesterol may be involved in breast cancer development, especially in Asian populations [27]. Further investigations involving basic research and preclinical trials are necessary to elucidate the role of cholesterol in the risk of breast cancer.
Compared to the general population, patients with breast cancer had a higher sodium intake and higher sodium/potassium intake ratio, and their prevalence of high blood pressure was significantly higher. Sodium and potassium are essential nutrients that serve many physiological functions. The dietary combination of low sodium and high potassium has been recommended as a strategy to prevent hypertension, chronic kidney disease, and cardiovascular disease [28]. Sodium added during food manufacturing and processing is the leading contributor of sodium intake in western countries. Among Korean food, kimchi, soy sauce, and soybeans are the main sources of sodium, and the liquid in broth-based dishes, including Korean soup, stew, and noodles/dumplings, accounts for at least approximately half of the total sodium content of those dishes [29]. To prevent hypertension and cardiovascular disease, Korean patients with breast cancer should reduce their intake of processed food, sauces, and broth-based dishes and increase their intake of potassium-rich foods such as legumes, whole grains, vegetables, and fruit [29].
Some limitations of this study should be considered when interpreting the results. First, the nutritional status and dietary pattern were assessed using a 24-hour recall of 1 day and the FFQ, which are disadvantageous because they lack accuracy for estimating the absolute intake [30]. Second, because of the nature of cross-sectional studies, residual confounding was possible. Third, we only included participants who were patients at two hospitals in Korea. Therefore, our results were affected by the limited sample size, and generalizability to the overall population of Korea, other races, and other countries may not be possible. Despite these limitations, to the best of our knowledge, this is the first study to exclusively compare the dietary habits of newly diagnosed patients with breast cancer with those of the general population of Korea using a 1:1 PS matching analysis. Further longitudinal studies with large samples are required to confirm these results. A comprehensive assessment to clarify the role of dietary habits in cancer mortality, chronic disease, and quality of life is also necessary.
Newly diagnosed patients with breast cancer had healthier dietary habits compared to the general population; however, there is considerable room for improvement in diet quality. These patients need to increase their omega-3 intake, lower their omega-3/omega-6 and sodium/potassium ratios, and reduce their red meat intake. Our results reinforce the need to develop tailored dietary recommendations for patients with breast cancer during the cancer diagnosis period and post-treatment period to improve their diet quality.
Notes
CONFLICT OF INTEREST
No potential conflict of interest relevant to this article was reported.
FUNDING
This work was supported by the Bio and Medical Technology Development Program through the National Research Foundation of Korea funded by the Ministry of Science, ICT, and Future Planning (NRF-2018R1D1A1B07049223), and by the Korea Institute of Planning and Evaluation for Technology in Food, Agriculture, and Forestry (IPET) through the High Value-Added Food Technology Development Program funded by the Ministry of Agriculture, Food, and Rural Affairs (MAFRA) (321030051HD030).
Acknowledgements
The authors thank all participants of this study.
SUPPLEMENTARY MATERIALS
Supplementary materials can be found via https://doi.org/10.4082/kjfm.23.0117.
Daily nutrient intake of control participants and patients with breast cancer assessed using the 24-hour recall method before propensity score matching.
Weekly food group frequency of control participants and patients with breast cancer patients before propensity score matching.