J Korean Acad Fam Med Search

CLOSE


Korean J Fam Med > Epub ahead of print
Kim, Lee, Linton, Song, and Lee: Comparison of Metabolic Risk Factors Based on the Type of Physical Activity in Korean Adolescents: Results from a Nationwide Population-Based Survey

Abstract

Background

Physical activity (PA) is associated with a favorable metabolic risk profile in adults. However, its role in adolescents remains unclear. In this study, using data (2019–2021) from the 8th Korea National Health and Nutrition Examination Survey, we investigated the optimal exercise type for preventing metabolic complications in adolescents.

Methods

A total of 1,222 eligible adolescent participants (12–18-year-old) were divided into four groups as follows: aerobic exercise (AE), resistance exercise (RE), combined aerobic and resistance exercise (CE), and no exercise (NE). Daily PA was assessed using the international PA questionnaire. Blood samples were collected to measure lipid, glucose, and insulin levels. Additionally, the homeostasis model assessment for insulin resistance (HOMA-IR) and triglyceride-glucose (TyG) indices were measured. Multivariate regression analysis was used to compare the metabolic risk factors across the PA groups before and after propensity score matching (PSM) adjustment for confounding variables.

Results

The CE group exhibited improved fasting glucose levels, lower TyG index, reduced white blood cell count, and higher high-density lipoprotein (HDL) cholesterol levels than the NE group. The RE group exhibited lower mean blood pressure, triglyceride, fasting insulin, HOMA-IR, TyG index and a reduced risk of metabolic syndrome than the NE group. The AE group had higher total and HDL cholesterol levels. In detailed comparison of the AE and RE groups, the RE group consistently exhibited favorable metabolic parameters, including lower blood pressure and total and low-density cholesterol levels, which persisted after PSM.

Conclusion

These findings highlight the positive effects of PA on cardiovascular risk factors in adolescents. Thus, RE may have a more favorable metabolic effect than AE. Further studies are needed to validate the benefits of exercise according to the exercise type.

INTRODUCTION

Adolescence, a pivotal stage in development, is characterized by marked physiological, social, and reproductive maturation. Changes during adolescence affect future health and health-related behaviors, raising concerns about their long-term impact on the health and well-being [1,2]. Metabolic disorders that manifest during childhood and adolescence pose increased risk of progressing to metabolic syndrome (MS), diabetes, and cardiovascular diseases (CVDs), which place considerable burden on global healthcare systems [3].
Promoting adequate physical activity (PA) is one of the most sustainable and beneficial approaches for combating metabolic disease [4]. Aerobic exercise (AE) is frequently recommended for obese individuals and offers benefits in terms of body composition, lipid profile, blood pressure (BP) control, glycemic control, and cardiorespiratory fitness [5]. Resistance training not only increases the muscle mass and strength, but also improves cardiovascular risk factors, like AE [6,7]. Several studies have shown that combining aerobic and resistance exercises (RE) has a more pronounced effect on reducing fat mass and weight while providing additional cardiovascular benefits than either AE or RE alone [8,9]. Although numerous studies have highlighted the advantages of PA, there is limited evidence regarding the most effective type of exercise for preventing metabolic complications, particularly in adolescents.
Our study aimed to evaluate and compare the benefits of AE and RE in reducing cardiovascular risk factors among adolescents using a representative sample of the general Korean population.

METHODS

1. Study Population

In this study, we analyzed pooled data (2019–2021) from the 8th Korea National Health and Nutrition Examination Survey (KNHANES). The KNHANES is conducted by the Korean Ministry of Health and Welfare, and targets non-institutionalized Korean citizens residing in Korea following a multi-stage clustered probability design sampling plan. The survey questions were prepared by the Korea Institute for Health and Social Affairs and the Korea Centers for Disease Control (KCDC; currently, Korea Disease Control and Prevention Agency), and approved by the ethics committee of the KCDC. Detailed information on KNHANES is available at https://knhanes.cdc.go.kr/knhanes/eng.
This study was performed in accordance with the Declaration of Helsinki and was approved by the Institutional Review Board (IRB) of the Severance Hospital, Seoul, South Korea (IRB approval no.: 4-2023-0877).
The study participants were Korean adolescents aged 12–18 years. Data pertaining to 1,431 adolescent participants were collected in the form of a health interview. Those with missing exercise questionnaires (n=114) and laboratory data (n=95) were excluded, and 1,222 eligible participants were included in the final analysis (Figure 1).

2. PA Questions and Classification of Aerobic Activity and Anaerobic Activity

1) Contents of PA questionnaire

The international PA questionnaire was used to assess the participants’ PA levels over a typical week. The questionnaire asked the participants to report days (and durations) on which they engaged in mild (involving walking for at least 10 minutes, encompassing activities at work, school, transportation, and exercise), moderate (activities such as double tennis or volleyball that increased heart rate or breathing for at least 10 minutes), or intense (vigorous activities, such as running or soccer, for at least 10 minutes) PA.
Participants noted the number of days and total duration of each activity (minimum of 10 minutes). The KNHANES categorizes PA into four types: (1) intense PA (resulting in breathlessness for >10 minutes); (2) medium-intensity PA (activities causing harder breathing or slightly shorter breaths for >10 minutes); (3) RE (including push-ups, situps, weights, and similar activities); and (4) exclusive walking exercise (comprising commuting and exercise). Each participant could belong to multiple exercise categories.

2) Classification of aerobic activity and anaerobic activity

The World Health Organization (WHO) recommends that children and adolescents (aged 5–17 years) should engage in at least 60 minutes per day of moderate-to-vigorous intensity, mostly aerobic, PA across the week. They should also include vigorous-intensity aerobic and muscle- and bone-strengthening activities for at least 3 days per week. Therefore, reducing sedentary time, primarily recreational screen time, is encouraged [10]. For PA measurements, the metabolic equivalent of task (MET) for moderate and vigorous aerobic activities are approximately 4 and 8, respectively. Based on the WHO recommendation of 60 minutes of daily aerobic activity, adolescents were categorized into AE group if they achieved a total of 600 MET×min/wk or more. Adolescents who engaged in strength training for more than 3 days in the previous week were categorized into RE group.

3. Covariates

Household income levels were categorized as low, medium-low, medium-high, or high. Educational level was classified as elementary, middle, or high school.
Body mass index (BMI) (kg/m2) was calculated as weight in kilograms divided by height in meters squared. Height was measured to the first decimal place (0.1 cm) using a stadiometer (SECA 225 in 2016–June 2019 and SECA 274 in July 2019–2020; Seca, Hamburg, Germany). Weight was accurately measured to the nearest 10 kilogram using an electronic balance (GL-6000–20; Gtech, Seoul, Korea). Waist circumference (WC) was measured at the midpoint between the lower margin of the rib cage and the upper margin of the iliac crest. BP was measured in a seated position (after a rest period of 5 minutes) in the right arm using a standard mercury sphygmomanometer (Baumanometer Wall Unit 33 [0850] in 2016–2019; W. A. Baum, Copiague, NY, USA and Greenlight 300 in 2020; Accoson, Irvine, UK).
The participants were categorized into four groups based on their BMI percentiles, according to the 2017 Korean national growth charts, as follows: underweight (below the 5th percentile), normal (5th to <85th percentile), overweight (85th to <95th percentile), and obese (≥95th percentile).
For laboratory assessments, all participants fasted for at least 8 hours prior to blood sampling. Blood samples were collected by trained medical personnel. Laboratory measurements included serum fasting glucose, total cholesterol, triglyceride, high-density lipoprotein cholesterol (HDL-C), low-density lipoprotein cholesterol (LDL-C), aspartate aminotransferase (AST), and alanine aminotransferase (ALT) levels measured using a Hitachi Automatic Analyzer 7600 (Hitachi, Tokyo, Japan). White blood cell (WBC) counts were measured using a laser flow cytometer (XN-9000; Sysmex, Tokyo, Japan).
Fasting insulin levels were assessed using an electrochemiluminescence immunoassay (Roche, Basel, Switzerland) and evaluated with a modular E801 analyzer (Roche). Insulin resistance was evaluated using the HOMA-IR (HOMA-IR=fasting insulin [μU/mL]×fasting glucose [mg/dL]/405) and TyG (TyG index=ln[triglyceride (mg/dL)×glucose (mg/dL)/2]) indices.
MS was defined using the criteria adapted from the National Cholesterol Education Program-Adult Treatment Panel III. According to the definition, MS required the presence of any three out of the five specified criteria: (1) WC ≥90th percentile for age and sex; (2) TG ≥110 mg/dL; (3) HDL-C ≤40 mg/dL; (4) systolic blood pressure (SBP) or diastolic blood pressure (DBP) ≥90th percentile for age, sex, and height; and (5) fasting glucose ≥110 mg/dL.11) The reference values for WC and BP were based on the growth charts issued by the Korean Pediatric Society.

4. Statistical Analysis

Prior to matching, data are presented as means±standard error or as prevalence (%). Sampling weights were used to account for the complex sampling. The characteristics of the exercise groups were compared using analysis of variance or Student t-test for continuous data and Pearson’s chi-square test. Multivariate regressions were performed to compare the PA groups associated with metabolic risk factors after adjusting for age, sex, educational, and household income status. The results are presented as coefficients and 95% confidence intervals (CI). MS-dependent variables were modeled using multiple logistic regression, and the results are reported as odds ratios (ORs) and 95% CI.
Sensitivity analyses were conducted using propensity score matching (PSM) to verify the robustness of our findings regarding the effects of PA on metabolic risk factors. We performed 1:1:1:1 PSM to mitigate the confounding effects of age and sex using the nearest-neighbor matching algorithm. Propensity score was defined as the probability of treatment assignment conditioned on the observed covariate [12]. Standardized mean differences (SMD) were calculated to evaluate the balance of covariates before and after propensity score implementation. An SMD <0.1 was considered the balanced distribution of data.
Statistical significance was set at two-sided P<0.05. All statistical analyses were conducted using R software ver. 4.3.0 (R Foundation for Statistical Computing, Vienna, Austria; https://www.r-project.org/).

RESULTS

The clinical characteristics of the participants are summarized in Table 1. Of the 1,222 participants, 662 (56.2%) were boys and 560 (45.8%) were girls. The mean age and BMI of the participants were 15.08 years and 22.05 kg/m2, respectively. When divided into four groups according to their PA status prior to matching, majority of the participants were in the no exercise (NE) group (865, 70.7%), followed by RE-only (141, 11.54%), AE-only (120, 9.82%), and CE groups (96, 7.86%). Among the four groups, there were significant differences in age, sex, educational status, BMI, triglyceride level, glucose level, TyG index, and AST level.
Following 1:1:1:1 PSM, 276 adolescents were matched based on their PA status for the sensitivity analysis. Differences in demographic, anthropometric, and metabolic risk factors, including glucose and lipid parameters, were analyzed in the 69 matched quadruplets (Table 1). No significant differences were noted among the four matched groups, except for fasting glucose levels.

1. Comparison of Metabolic Parameters between the Four PA Groups

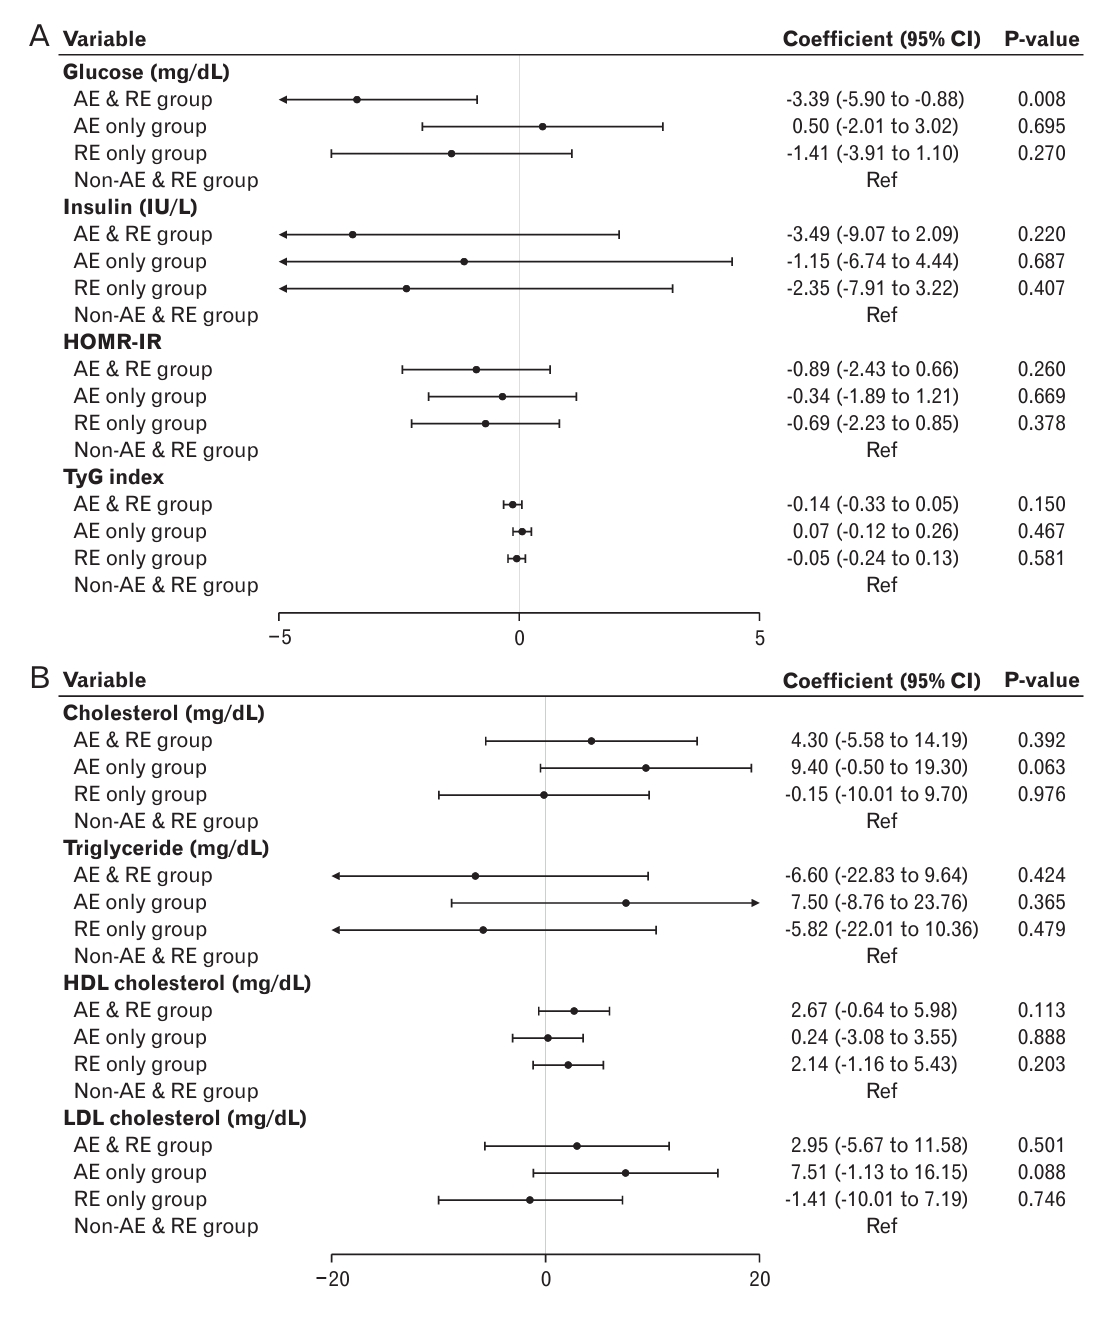
Table 2 and Figure 1 show the regression coefficients of anthropometric and metabolic parameters among the four PA groups. Fasting glucose, TyG index, and WBC count were lower, whereas HDL-C levels were higher in the AE and RE groups compared with that in the NE group. The RE-only group showed decreased values of mean BP, triglycerides, fasting insulin, HOMA-IR, and TyG index; however, it showed increased HDL-C levels compared to the NE group. Total cholesterol and HDL-C levels were significantly higher in the AE-only group compared with that in the NE group. Compared with the NE group, the OR of MS in the RE-only group was significantly lower (OR, 0.228; 95% CI, 0.069–0.756; P=0.016).
The forest plot depicts a comparison of metabolic parameters and cardiovascular risk factors among the four PA groups (Figure 2).
After PSM, when anthropometric and metabolic risks of the CE group were compared with that of the NE group, the results showed a trend similar to that before matching. However, the glucose levels were significantly lower in the CE group than that in the NE group after adjusting for age, sex, educational status, and household income (Appendix 1).

2. Comparison of Metabolic Parameters between AE- and RE-only groups

We performed a subgroup analysis to investigate differences in metabolic risk between the AE- and RE-only groups. Prior to and after the 1:1 PSM, the RE group had lower total and LDL-C levels than the AE group (Table 3).
Table 4 and Figure 3 show the correlation coefficients of the anthropometries and metabolic indices, and the OR of MS in the RE-only group, with the AE group set as a reference prior to matching. Compared to the AE-only group, the RE-only group showed significantly lower mean BP (-2.041; 95% CI, -3.957 to -0.125; P=0.037), total cholesterol (-8.881; 95% CI, -15.855 to -1.807; P=0.014), and LDL-C levels (0.762; 95% CI, -13.646 to -1.081; P=0.014).
After PSM, the comparison of glucose and lipid metabolism parameters between the RE- and NE-only groups showed similar trends to those prior to matching (Appendix 2, Figure 3). In addition, compared to the AE-only group, the RE-only group showed a significantly lower TyG index (-1.158; 95% CI, -0.313 to -0.002; P=0.046) after matching (Figure 3).

DISCUSSION

Despite various guidelines endorsing PA for adolescents, the type of exercise that is most effective in reducing cardiovascular risk in this age group remains unclear. Comparing the benefits of each exercise modality can lead to better exercise recommendations for adolescents with or at risk for MS.
Comparison of metabolic parameters in the CE and NE groups revealed that the CE group exhibited lower fasting glucose, TyG index, and WBC count but higher levels of HDL-C. The RE-only group showed reduced mean BP, triglycerides, fasting insulin, and insulin resistance indices (HOMA-IR and TyG), along with increased HDL-C compared to the NE group. Additionally, the RE-only group had significantly lower odds of developing MS than the NE group. In contrast, the AE-only group showed higher total cholesterol and HDL-C levels. In a detailed comparison of the AE and RE groups, the RE group consistently exhibited favorable metabolic parameters, including lower BP and total and LDL-C levels, which persisted even after PSM.
The WHO recommends 60 minutes of moderate-to-high-intensity PA for children and adolescents, including muscle-strengthening exercises for at least 3 days per week [13]. However, our study found that over 70% of Korean adolescents did not meet this minimum recommended PA level, with only 40% incorporating resistance training, and their compliance with these standards trailing significantly behind those of other nations [14,15]. Given these results, it is essential to create a plan that enables students to engage in PA at school, home, and while commuting. Strength training and increased exercise volumes can enhance the overall metabolic health of adolescents.
Given the lasting impact of the CVD risk from youth to adulthood [16], it is essential to highlight that healthy lifestyle habits that develop through daily PA during adolescence often persist into adulthood [17]. Robust evidence suggests that a sedentary lifestyle contributes to the pathogenesis of MS [18,19]. In contrast, PA not only enhances physical fitness but also has a positive impact on cardiometabolic health in the youth, as confirmed by previous studies [20,21].
PA enhances insulin sensitivity by addressing critical factors in the pathophysiology of insulin resistance, such as adiposity, inflammation, and disrupted glucose metabolism [22]. In addition, it positively affects plasma lipids, particularly triglycerides and HDL-C [23]. Moreover, PA of any intensity is linked to lower BP, suggesting its value in improving the metabolic health of adolescents [16]. However, limited and inconsistent data are available on the comparative effects of AE and RE on cardiovascular and metabolic parameters in adolescents.
AE notably enhanced cardiorespiratory fitness, whereas RE and CE improved muscular strength and endurance more effectively than the control conditions or AE-alone in adolescents [7]. Although there is limited information on the impact of RE on cardiovascular health compared to that of AE, our findings indicate that RE outperforms AE-alone in reducing lipid parameters and the TyG insulin resistance index, even after adjusting for demographic covariates. The HEARTY trial (healthy eating, aerobic and resistance training in youth trial) reported that insulin resistance tended to persist in young individuals transitioning into puberty and increased their cardiometabolic risk in adulthood along with early onset of dyslipidemia in childhood and adolescence [24], and showed that effective management of insulin resistance and lipid profile through RE in adolescents may reduce the risk of premature CVD [25].
Our study had several limitations. First, the cross-sectional design did not establish causality. Especially in adolescents, the type of exercise may be influenced by external factors, such as parental guidance, and other variables such as obesity, socioeconomic status, and age. To compensate for this limitation, we used PSM, which successfully reduces the bias between groups. Second, there are inconsistencies between the results of previous studies and ours. Several studies have revealed that AE and CE are superior to RE [8,26-28]. The precise reasons for the inconsistent results remain to be elucidated and are possibly influenced by factors such as racial disparities, sample sizes, and variations in exercise type and strength. Therefore, further extensive prospective cohort studies with larger population and meticulously designed clinical trials are warranted to establish the optimal exercise regimen for adolescents. Third, there were substantial discrepancies in demographic characteristics, such as sex and BMI, prior to matching. Consequently, a limitation arose regarding the reduced availability of matching data with similar characteristics: the proportion of female adolescents was lower than male adolescents. However, PSM remains a valuable method for reducing baseline group differences, particularly when randomized controlled trials are not feasible. Fourth, our study did not consider essential dietary factors among the various lifestyle factors that can influence the cardiovascular risk. Finally, we relied on self-reported questionnaires to evaluate PA, potentially weakening the connection between AE and RE, and their impact on glucose and lipid parameters.
Despite these limitations, this study has several strengths. To the best of our knowledge, this is the first study to identify a positive association between RE and metabolic indices compared with AE in adolescents. Additionally, we conducted a sensitivity analysis using a 1:1 PSM approach, using a well-known database that accurately represents the Korean population.
The findings of this study provide valuable insight into the positive effects of PA on cardiovascular risk factors in adolescents. In addition, our study suggests that RE may be superior to AE in improving metabolic risk factors in adolescents. Further studies are warranted to confirm the relative benefits of exercise, based on the type of exercise.

Notes

CONFLICT OF INTEREST

No potential conflict of interest relevant to this article was reported.

FUNDING

This study received support from a Korea Evaluation Institute of Industrial Technology (KEIT) grant funded by the Korean government’s Ministry of Trade, Industry, and Energy (MOTIE) (grant no., 20018384) awarded to the author (J.W.L.). It’s important to emphasize that the funding source not been involved in shaping the study design, data collection, analysis, decisions regarding publication, or preparation of the manuscript.

ACKNOWLEDGMENTS

The data for this study were obtained from the Korea National Health and Nutrition Examination Survey, which was administered by the Korea Center for Disease Control and Prevention (currently, Korea Disease Control and Prevention Agency) under the Ministry of Health and Welfare of the Republic of Korea.

Figure. 1.
Flow chart of the study population selection. KNHANES, Korea National Health and Nutrition Examination Survey; CE, complex exercise; AE, aerobic exercise; RE, resistance exercise; NE, no exercise; PSM, propensity score matching.
kjfm-23-0164f1.jpg
Figure. 2.
(A, B) Forest plot showing the comparison of metabolic parameters and cardiovascular risk factors between the four physical activity groups. CI, confidence interval; AE, aerobic exercise; RE, resistance exercise; Ref, reference; HOMA-IR, homeostasis model assessment-estimated insulin resistance; TyG, triglyceride and glucose; HDL, high-density lipoprotein; LDL, low-density lipoprotein.
kjfm-23-0164f2.jpg
Figure. 3.
(A, B) Forest plot showing the comparison of metabolic parameters and cardiovascular risk factors between aerobic and resistance exercise groups. CI, confidence interval; AE, aerobic exercise; RE, resistance exercise; Ref, reference; HOMA-IR, homeostasis model assessment-estimated insulin resistance; TyG, triglyceride and glucose; HDL, high-density lipoprotein; LDL, low-density lipoprotein.
kjfm-23-0164f3.jpg
Table 1.
Clinical characteristics according to exercise type (before and after matching)
Characteristic Before matching
After matching
Overall CE group AE only group RE only group Non-AE & RE group P-value Overall CE group AE only group RE only group Non-AE & RE group P-value
Unweighted no. 1,222 96 120 141 865 276 69 69 69 69
Age (y) 15.08±2.00 15.73±1.84 14.51±1.88 15.31±1.99 15.04±2.02 <0.001 14.93±1.86 14.93±1.87 14.93±1.87 14.93±1.87 14.93±1.87 >0.999
Sex <0.001 >0.999
 Male 54.2 82.8 63.6 78 45.6 82.6 82.6 82.6 82.6 82.6
 Female 45.8 17.2 36.4 22 54.4 17.4 17.4 17.4 17.4 17.4
Educational status <0.001 0.866
 Elementary school 49.3 44.6 64.6 49.5 47.9 57.2 58 60.9 56.5 53.6
 Middle school 44.1 36.9 33.7 43.6 46.3 35.1 31.9 34.8 34.8 39.1
 High school 6.6 18.5 1.7 6.9 5.8 7.6 10.1 4.3 8.7 7.2
Household income status 0.509 0.862
 Low 9.1 9.1 2.7 11.1 9.5 9.4 10.1 5.8 13 8.7
 Mid-low 26.8 23.9 28.3 22.3 27.6 30.1 33.3 30.4 29 27.5
 Mid-high 33.5 39.5 35.3 38.7 31.7 33.3 36.2 34.8 29 33.3
 High 30.7 27.4 33.6 27.8 31.2 27.2 20.3 29 29 30.4
Body mass index (kg/m2) 0.037 0.947
 Underweight (<18.5) 20.5 9.8 21.1 16.8 22.4 14.5 14.5 13 17.4 13
 Normal (≥18.5 and <25.0) 58.6 75.2 53 61 57 63.8 66.7 62.3 59.4 66.7
 Obese (≥25.0) 20.8 15 25.9 22.2 20.6 21.7 18.8 24.6 23.2 20.3
Waist circumference (cm) 74.21±11.49 76.10±9.26 74.85±11.99 75.20±11.65 73.74±11.62 0.138 75.66±11.11 74.55±9.34 76.42±11.58 75.23±12.43 76.43±10.97 0.697
Mean blood pressure (mm Hg) 81.99±7.89 82.69±8.56 82.31±8.59 81.21±7.67 81.99±7.75 0.544 82.23±7.83 81.76±7.59 83.27±8.19 81.36±8.35 82.53±7.15 0.494
Cholesterol (mg/dL) 161.91±27.38 160.96±30.02 166.90±29.46 158.46±25.41 161.96±27.05 0.139 160.17±30.02 161.16±30.92 165.99±32.11 156.41±26.17 157.14±30.25 0.217
Tryglyceride (mg/dL) 88.94±51.13 82.93±52.23 89.88±50.29 79.20±35.91 91.16±53.06 0.02 81.89±48.50 76.88±48.98 90.74±57.30 76.87±37.91 83.09±47.54 0.283
HDL cholesterol (mg/dL) 51.00±9.78 51.79±10.78 52.42±8.54 51.64±8.80 50.62±9.95 0.205 52.57±10.18 53.91±10.39 51.51±9.20 53.46±9.54 51.41±11.43 0.337
LDL cholesterol (mg/dL) 93.87±24.23 93.71±27.42 96.74±26.59 91.25±22.33 93.96±23.82 0.386 91.73±25.93 92.50±26.62 96.84±29.41 87.88±22.95 89.70±23.91 0.196
Glucose (mg/dL) 91.98±9.47 89.62±7.86 93.17±8.45 91.91±6.33 92.12±10.15 0.036 92.54±7.85 90.30±8.51 94.33±7.96 92.10±6.52 93.41±7.86 0.016
Insulin (IU/L) 15.52±14.64 13.40±23.12 17.34±16.86 13.81±9.39 15.83±13.72 0.108 15.50±16.78 13.87±26.01 15.80±12.31 14.91±11.40 17.43±13.20 0.646
HOMR-IR 3.62±3.79 3.15±6.41 4.11±4.24 3.19±2.30 3.68±3.49 0.11 3.68±4.62 3.31±7.22 3.76±3.02 3.47±2.79 4.20±4.13 0.694
Hemoglobin A1c (%) 5.40±0.32 5.43±0.25 5.42±0.28 5.38±0.25 5.40±0.35 0.472 5.42±0.25 5.45±0.25 5.42±0.29 5.38±0.22 5.44±0.23 0.397
TyG index 8.18±0.52 8.06±0.58 8.20±0.56 8.11±0.44 8.21±0.51 0.037 8.09±0.56 7.99±0.58 8.19±0.60 8.06±0.49 8.12±0.56 0.197
AST (IU/L) 20.87±11.63 25.26±26.13 21.47±9.49 21.97±10.28 20.08±8.87 0.02 22.58±17.53 24.51±31.03 21.35±7.54 23.17±12.58 21.30±7.56 0.657
ALT (IU/L) 18.22±18.10 19.27±15.12 18.08±19.43 18.98±15.58 17.98±18.65 0.843 19.87±17.96 18.88±17.49 19.06±15.44 21.01±22.71 20.52±15.54 0.87
WBC (thousand/μL) 6.49±1.54 6.18±1.67 6.56±1.80 6.26±1.45 6.56±1.49 0.055 6.35±1.62 6.05±1.96 6.45±1.55 6.43±1.43 6.47±1.50 0.353
Metabolic syndrome (yes) 4.9 4 3.7 1.6 5.7 0.174 2.9 2.9 4.3 1.4 2.9 0.96

Values are presented as unweighted number, mean±standard error, or % unless otherwise stated.

CE, complex exercise; AE, aerobic exercise; RE, resistance exercise; HDL, high-density lipoprotein; LDL, low-density lipoprotein; HOMA-IR, homeostasis model assessment-estimated insulin resistance; TyG, triglyceride and glucose; AST, aspartate aminotransferase; ALT, alanine aminotransferase; WBC, white blood cell.

Table 2.
Comparison of clinical characteristics between AE only, RE only, non-AE & RE group, and CE group, before matching
Variable CE group
AE only group
RE only group
Non-AE & RE group
P-value
Coefficient (95% CI) P-value Coefficient (95% CI) P-value Coefficient (95% CI) P-value Coefficient (95% CI) P-value
Body mass index (kg/m2) -0.323 (-1.161 to 0.516) 0.449 0.471 (-0.590 to 1.531) 0.383 -0.275 (-1.132 to 0.581) 0.528 Ref Ref 0.624
Waist circumference (cm) -1.139 (-3.437 to 1.159) 0.33 0.172 (-2.379 to 2.722) 0.895 -1.197 (-3.525 to 1.131) 0.313 Ref Ref 0.666
Mean BP (mm Hg) -1.172 (-3.235 to 0.891) 0.265 0.122 (-1.756 to 2.000) 0.898 -2.069 (-3.528 to -0.610) 0.006 Ref Ref 0.026
Cholesterol (mg/dL) 1.573 (-5.212 to 8.358) 0.649 7.579 (1.248 to 13.911) 0.019 -0.323 (-5.153 to 4.507) 0.895 Ref Ref 0.121
Triglyceride (mg/dL) -9.982 (-23.495 to 3.531) 0.147 -1.491 (-11.731 to 8.749) 0.775 -13.329 (-21.635 to -5.023) 0.002 Ref Ref 0.009
HDL cholesterol (mg/dL) 2.937 (0.175 to 5.699) 0.037 2.874 (1.085 to 4.662) 0.002 2.688 (1.045 to 4.331) 0.001 Ref Ref <0.001
LDL cholesterol (mg/dL) 0.772 (-5.262 to 6.806) 0.801 4.407 (-1.300 to 10.114) 0.13 -1.068 (-5.297 to 3.162) 0.62 Ref Ref 0.413
Glucose (mg/dL) -3.167 (-5.136 to -1.197) 0.002 0.428 (-1.484 to 2.341) 0.66 -0.719 (-2.082 to 0.644) 0.3 Ref Ref 0.015
Insulin (IU/L) -2.378 (-7.528 to 2.773) 0.365 0.572 (-2.689 to 3.832) 0.731 -2.368 (-4.580 to -0.155) 0.036 Ref Ref 0.166
HOMR-IR -0.547 (-1.954 to 0.859) 0.445 0.186 (-0.621 to 0.992) 0.651 -0.589 (-1.126 to -0.053) 0.031 Ref Ref 0.145
Hemoglobin A1c (%) 0.046 (-0.021 to 0.113) 0.177 0.017 (-0.043 to 0.078) 0.573 -0.014 (-0.067 to 0.040) 0.618 Ref Ref 0.416
TyG index -0.169 (-0.315 to -0.022) 0.024 -0.027 (-0.148 to 0.094) 0.662 -0.120 (-0.218 to -0.022) 0.016 Ref Ref 0.012
AST (IU/L) 3.672 (-0.783 to 8.128) 0.106 0.654 (-1.338 to 2.646) 0.519 0.579 (-1.360 to 2.518) 0.557 Ref Ref 0.366
ALT (IU/L) -2.419 (-5.880 to 1.042) 0.17 -1.181 (-5.074 to 2.713) 0.551 -2.189 (-5.490 to 1.112) 0.193 Ref Ref 0.423
WBC (thousand/μL) -0.427 (-0.820 to -0.033) 0.034 0.019 (-0.384 to 0.421) 0.927 -0.287 (-0.599 to 0.025) 0.072 Ref Ref 0.047
Metabolic syndrome (yes) 0.547* (0.139 to 2.153) 0.387 0.685* (0.269 to 1.745) 0.427 0.228* (0.069 to 0.756) 0.016 Ref Ref 0.088

CE, complex exercise; AE, aerobic exercise; RE, resistance exercise; CI, confidence interval; Ref, reference; BP, blood pressure; HDL, high-density lipoprotein; LDL, low-density lipoprotein; HOMA-IR, homeostasis model assessmentestimated insulin resistance; TyG, triglyceride and glucose; AST, aspartate aminotransferase; ALT, alanine aminotransferase; WBC, white blood cell.

* This value represents the odds ratio.

Table 3.
Clinical characteristics aerobic exercise group and resistance exercise group
Characteristic Before matching
After matching
Overall AE only group RE only group P-value Overall AE only group RE only group P-value
Unweighted no. 261 120 141 188 94 94
Age (y) 14.59±2.00 14.13±1.86 14.99±2.03 <0.001 14.37±1.90 14.37±1.91 14.37±1.91 >0.999
Sex 0.006 >0.999
 Male 72 63.3 79.4 78.7 78.7 78.7
 Female 28 36.7 20.6 21.3 21.3 21.3
Educational status 0.02 0.805
 Elementary school 64 72.5 56.7 68.6 70.2 67
 Middle school 31 25 36.2 27.1 26.6 27.7
 High school 5 2.5 7.1 4.3 3.2 5.3
Household income status 0.062 0.137
 Low 6.9 3.3 9.9 7.4 4.3 10.6
 Mid-low 26.8 31.7 22.7 27.1 31.9 22.3
 Mid-high 37.9 34.2 41.1 39.4 35.1 43.6
 High 28.4 30.8 26.2 26.1 28.7 23.4
Body mass index (kg/m2) 0.839 0.429
 Underweight (<18.5) 18.4 19.2 17.7 18.1 16 20.2
 Normal (≥18.5 and <25.0) 58.6 56.7 60.3 59 57.4 60.6
 Obese (≥25.0) 23 24.2 22 22.9 26.6 19.1
Waist circumference (cm) 74.75±11.63 74.71±11.71 74.79±11.60 0.955 75.35±11.98 76.38±12.02 74.33±11.92 0.242
Mean blood pressure (mm Hg) 81.08±8.10 81.13±8.15 81.04±8.08 0.929 81.23±8.18 82.13±8.24 80.33±8.05 0.13
Cholesterol (mg/dL) 163.50±28.05 169.19±29.18 158.65±26.19 0.003 161.96±28.68 167.04±31.03 156.87±25.27 0.015
Triglyceride (mg/dL) 85.27±44.03 90.27±50.07 81.01±37.81 0.098 85.61±47.00 92.32±53.35 78.90±38.79 0.05
HDL cholesterol (mg/dL) 52.09±9.10 52.02±8.69 52.16±9.46 0.901 51.63±9.03 51.09±8.63 52.17±9.43 0.411
LDL cholesterol (mg/dL) 94.69±24.95 99.42±26.59 90.67±22.79 0.005 93.61±25.77 97.87±28.92 89.34±21.49 0.023
Glucose (mg/dL) 92.55±7.21 92.80±8.16 92.34±6.32 0.616 93.11±7.44 93.82±8.16 92.40±6.62 0.193
Insulin (IU/L) 15.59±13.10 16.91±16.27 14.47±9.53 0.15 16.07±12.71 17.18±14.40 14.95±10.72 0.23
HOMR-IR 3.65±3.28 3.99±4.11 3.35±2.32 0.135 3.78±3.15 4.08±3.60 3.48±2.62 0.194
Hemoglobin A1c (%) 5.40±0.26 5.42±0.27 5.39±0.25 0.398 5.41±0.26 5.40±0.28 5.42±0.24 0.559
TyG index 8.16±0.50 8.20±0.56 8.13±0.45 0.286 8.16±0.54 8.22±0.59 8.09±0.48 0.119
AST (IU/L) 22.03±10.46 21.41±9.46 22.55±11.26 0.373 22.05±10.28 22.10±10.38 22.01±10.24 0.955
ALT (IU/L) 18.87±18.61 17.97±19.80 19.63±17.57 0.477 19.56±20.99 19.68±21.94 19.45±20.11 0.939
WBC (thousand/μL) 6.37±1.59 6.43±1.73 6.31±1.46 0.553 6.42±1.59 6.55±1.74 6.29±1.44 0.25
Metabolic syndrome (yes) 3.4 5 2.1 0.309 3.7 5.3 2.1 0.444

Values are presented as unweighted number, mean±standard error, or % unless otherwise stated.

AE, aerobic exercise; RE, resistance exercise; HDL, high-density lipoprotein; LDL, low-density lipoprotein; HOMA-IR, homeostasis model assessment-estimated insulin resistance; TyG, triglyceride and glucose; AST, aspartate aminotransferase; ALT, alanine aminotransferase; WBC, white blood cell.

Table 4.
Comparison between aerobic exercise and resistance exercise, before matching
Variable AE only group RE only group
Coefficient (95% CI) P-value
Body mass index (kg/m2) Ref -0.670 (-1.806 to 0.466) 0.247
Waist circumference (cm) Ref -1.378 (-4.316 to 1.560) 0.357
Mean blood pressure (mm Hg) Ref -2.041 (-3.957 to -0.125) 0.037
Cholesterol (mg/dL) Ref -8.831 (-15.855 to -1.807) 0.014
Triglyceride (mg/dL) Ref -11.035 (-22.231 to 0.160) 0.053
High-density lipoprotein cholesterol (mg/dL) Ref 0.762 (-1.547 to 3.071) 0.516
Low-density lipoprotein cholesterol (mg/dL) Ref -7.363 (-13.646 to -1.081) 0.022
Glucose (mg/dL) Ref -0.220 (-2.061 to 1.622) 0.814
Insulin (IU/L) Ref -1.546 (-4.844 to 1.752) 0.357
Homeostasis model assessment-estimated insulin resistance Ref -0.418 (-1.244 to 0.407) 0.319
Hemoglobin A1c (%) Ref -0.006 (-0.072 to 0.060) 0.861
Triglyceride and glucose index Ref -0.071 (-0.200 to 0.058) 0.281
Aspartate aminotransferase (IU/L) Ref 0.730 (-1.954 to 3.414) 0.593
Alanine aminotransferase (IU/L) Ref 0.427 (-4.378 to 5.232) 0.861
White blood cell (thousand/μL) Ref -0.159 (-0.567 to 0.250) 0.446
Metabolic syndrome (yes) Ref 0.315* (0.058 to 1.372) 0.14

AE, aerobic exercise; RE, resistance exercise; CI, confidence interval; Ref, reference.

* This value represents the odds ratio.

REFERENCES

1. Jebeile H, Kelly AS, O’Malley G, Baur LA. Obesity in children and adolescents: epidemiology, causes, assessment, and management. Lancet Diabetes Endocrinol 2022;10:351-65.
crossref pmid pmc
2. Norris SA, Frongillo EA, Black MM, Dong Y, Fall C, Lampl M, et al. Nutrition in adolescent growth and development. Lancet 2022;399:172-84.
crossref pmid
3. Horesh A, Tsur AM, Bardugo A, Twig G. Adolescent and childhood obesity and excess morbidity and mortality in young adulthood: a systematic review. Curr Obes Rep 2021;10:301-10.
crossref pmid pdf
4. Lazzer S, Tringali G, Caccavale M, De Micheli R, Abbruzzese L, Sartorio A. Effects of high-intensity interval training on physical capacities and substrate oxidation rate in obese adolescents. J Endocrinol Invest 2017;40:217-26.
crossref pmid pdf
5. Alberga AS, Frappier A, Sigal RJ, Prud’homme D, Kenny GP. A review of randomized controlled trials of aerobic exercise training on fitness and cardiometabolic risk factors in obese adolescents. Phys Sportsmed 2013;41:44-57.
crossref pmid
6. Kelly L. Strength training: get stronger, leaner, healthier. Mayo Clinic News Network; 2021.

7. Schranz N, Tomkinson G, Olds T. What is the effect of resistance training on the strength, body composition and psychosocial status of overweight and obese children and adolescents?: a systematic review and meta-analysis. Sports Med 2013;43:893-907.
crossref pmid pdf
8. Sanches IC, Conti FF, Bernardes N, Brito Jde O, Galdini EG, Cavaglieri CR, et al. Impact of combined exercise training on cardiovascular autonomic control and mortality in diabetic ovariectomized rats. J Appl Physiol (1985) 2015;119:656-62.
crossref pmid
9. Damaso AR, da Silveira Campos RM, Caranti DA, de Piano A, Fisberg M, Foschini D, et al. Aerobic plus resistance training was more effective in improving the visceral adiposity, metabolic profile and inflammatory markers than aerobic training in obese adolescents. J Sports Sci 2014;32:1435-45.
pmid
10. 2018 Physical Activity Guidelines Advisory Committee. 2018 Physical Activity Guidelines Advisory Committee Scientific Report. Washington (DC): U.S. Department of Health and Human Services; 2018.

11. Cook S, Weitzman M, Auinger P, Nguyen M, Dietz WH. Prevalence of a metabolic syndrome phenotype in adolescents: findings from the third National Health and Nutrition Examination Survey, 1988-1994. Arch Pediatr Adolesc Med 2003;157:821-7.
crossref pmid
12. Rosenbaum PR, Rubin DB. The central role of the propensity score in observational studies for causal effects. Biometrika 1983;70:41-55.
crossref
13. Martin A, Booth JN, Laird Y, Sproule J, Reilly JJ, Saunders DH. Physical activity, diet and other behavioural interventions for improving cognition and school achievement in children and adolescents with obesity or overweight. Cochrane Database Syst Rev 2018;3:CD009728.
crossref pmid
14. Lubans DR, Smith JJ, Eather N, Leahy AA, Morgan PJ, Lonsdale C, et al. Time-efficient intervention to improve older adolescents’ cardiorespiratory fitness: findings from the ‘Burn 2 Learn’ cluster randomised controlled trial. Br J Sports Med 2020;55:751-8.
crossref pmid
15. Cai Y, Zhu X, Wu X. Overweight, obesity, and screen-time viewing among Chinese school-aged children: national prevalence estimates from the 2016 Physical Activity and Fitness in China: the youth study. J Sport Health Sci 2017;6:404-9.
crossref pmid pmc
16. Leister KR, Cilhoroz BT, Rosenberg J, Brown EC, Kim JY. Metabolic syndrome: operational definitions and aerobic and resistance training benefits on physical and metabolic health in children and adolescents. Diabetes Metab Syndr 2022;16:102530.
crossref pmid
17. Malina RM. Tracking of physical activity and physical fitness across the lifespan. Res Q Exerc Sport 1996;67:S48-57.
crossref pmid
18. Lakka TA, Laaksonen DE, Lakka HM, Mannikko N, Niskanen LK, Rauramaa R, et al. Sedentary lifestyle, poor cardiorespiratory fitness, and the metabolic syndrome. Med Sci Sports Exerc 2003;35:1279-86.
crossref pmid
19. Farrell SW, Cheng YJ, Blair SN. Prevalence of the metabolic syndrome across cardiorespiratory fitness levels in women. Obes Res 2004;12:824-30.
crossref pmid
20. Judice PB, Hetherington-Rauth M, Northstone K, Andersen LB, Wedderkopp N, Ekelund U, et al. Changes in physical activity and sedentary patterns on cardiometabolic outcomes in the transition to adolescence: International Children’s Accelerometry Database 2.0. J Pediatr 2020;225:166-73.
crossref pmid
21. Segura-Jimenez V, Parrilla-Moreno F, Fernandez-Santos JR, Esteban-Cornejo I, Gomez-Martinez S, Martinez-Gomez D, et al. Physical fitness as a mediator between objectively measured physical activity and clustered metabolic syndrome in children and adolescents: the Up&Down study. Nutr Metab Cardiovasc Dis 2016;26:1011-9.
crossref pmid
22. Venkatasamy VV, Pericherla S, Manthuruthil S, Mishra S, Hanno R. Effect of physical activity on insulin resistance, inflammation and oxidative stress in diabetes mellitus. J Clin Diagn Res 2013;7:1764-6.
pmid pmc
23. Scher-Nemirovsky EA, Ruiz-Manco D, Mendivi CO. Impact of exercise on lipid metabolism and dyslipidemia. Rev Nutr Clin Metab 2019;2:26-36.
crossref
24. Kelsey MM, Zeitler PS. Insulin resistance of puberty. Curr Diab Rep 2016;16:64.
crossref pmid pdf
25. Lee S, Kim Y, Kuk JL. What is the role of resistance exercise in improving the cardiometabolic health of adolescents with obesity? J Obes Metab Syndr 2019;28:76-91.
crossref pmid pmc
26. Lee S, Deldin AR, White D, Kim Y, Libman I, Rivera-Vega M, et al. Aerobic exercise but not resistance exercise reduces intrahepatic lipid content and visceral fat and improves insulin sensitivity in obese adolescent girls: a randomized controlled trial. Am J Physiol Endocrinol Metab 2013;305:E1222-9.
crossref pmid pmc
27. Conti FF, Brito Jde O, Bernardes N, Dias Dda S, Malfitano C, Morris M, et al. Positive effect of combined exercise training in a model of metabolic syndrome and menopause: autonomic, inflammatory, and oxidative stress evaluations. Am J Physiol Regul Integr Comp Physiol 2015;309:R1532-9.
crossref pmid
28. Ho SS, Dhaliwal SS, Hills AP, Pal S. The effect of 12 weeks of aerobic, resistance or combination exercise training on cardiovascular risk factors in the overweight and obese in a randomized trial. BMC Public Health 2012;12:704.
crossref pmid pmc pdf

Appendices

Appendix 1.

Comparison of clinical characteristics among the AE-only, RE-only, and non-AE and RE, and CE groups, after matching

Variable CE group
AE only group
RE only group
Non-AE & RE group
P-value
Coefficient (95% CI) P-value Coefficient (95% CI) P-value Coefficient (95% CI) P-value Coefficient (95% CI) P-value
Body mass index (kg/m2) -0.337 (-1.700 to 1.027) 0.627 0.415 (-0.951 to 1.781) 0.55 -0.102 (-1.462 to 1.257) 0.882 Ref Ref 0.747
Waist circumference (cm) -1.661 (-5.328 to 2.005) 0.373 0.463 (-3.210 to 4.136) 0.804 -1.005 (-4.660 to 2.651) 0.589 Ref Ref 0.662
Mean BP (mm Hg) -0.622 (-3.058 to 1.815) 0.616 0.644 (-1.797 to 3.085) 0.604 -0.903 (-3.332 to 1.527) 0.465 Ref Ref 0.606
Cholesterol (mg/dL) 4.301 (-5.584 to 14.186) 0.392 9.400 (-0.502 to 19.303) 0.063 -0.151 (-10.006 to 9.704) 0.976 Ref Ref 0.19
Triglyceride (mg/dL) -6.595 (-22.828 to 9.638) 0.424 7.502 (-8.760 to 23.764) 0.365 -5.823 (-22.007 to 10.361) 0.479 Ref Ref 0.295
HDL cholesterol (mg/dL) 2.671 (-0.638 to 5.979) 0.113 0.237 (-3.077 to 3.551) 0.888 2.136 (-1.162 to 5.434) 0.203 Ref Ref 0.285
LDL cholesterol (mg/dL) 2.951 (-5.674 to 11.577) 0.501 7.507 (-1.135 to 16.148) 0.088 -1.414 (-10.013 to 7.186) 0.746 Ref Ref 0.189
Glucose (mg/dL) -3.389 (-5.900 to -0.878) 0.008 0.501 (-2.015 to 3.016) 0.695 -1.405 (-3.909 to 1.098) 0.27 Ref Ref 0.012
Insulin (IU/L) -3.486 (-9.065 to 2.093) 0.22 -1.146 (-6.735 to 4.443) 0.687 -2.345 (-7.908 to 3.217) 0.407 Ref Ref 0.639
HOMR-IR -0.886 (-2.432 to 0.660) 0.26 -0.337 (-1.885 to 1.212) 0.669 -0.692 (-2.233 to 0.849) 0.378 Ref Ref 0.684
Hemoglobin A1c (%) 0.015 (-0.069 to 0.098) 0.731 -0.020 (-0.103 to 0.063) 0.637 -0.055 (-0.138 to 0.028) 0.192 Ref Ref 0.382
TyG index -0.138 (-0.326 to 0.050) 0.15 0.070 (-0.119 to 0.258) 0.467 -0.053 (-0.240 to 0.135) 0.581 Ref Ref 0.174
AST (IU/L) 3.207 (-2.656 to 9.070) 0.282 0.690 (-5.183 to 6.564) 0.817 1.866 (-3.979 to 7.712) 0.53 Ref Ref 0.72
ALT (IU/L) -1.101 (-7.046 to 4.844) 0.716 -0.770 (-6.725 to 5.186) 0.799 0.911 (-5.016 to 6.838) 0.762 Ref Ref 0.913
WBC (thousand/μL) -0.371 (-0.917 to 0.175) 0.182 0.050 (-0.497 to 0.597) 0.858 -0.013 (-0.558 to 0.531) 0.962 Ref Ref 0.407
Metabolic syndrome (yes) 1.094* (0.124 to 9.611) 0.931 1.505* (0.231 to 12.148) 0.668 0.536* (0.024 to 5.958) 0.62 Ref Ref 0.834

AE, aerobic exercise; RE, resistance exercise; CE, complex exercise; CI, confidence interval; Ref, reference; BP, blood pressure; HDL, high-density lipoprotein; LDL, low-density lipoprotein; HOMA-IR, homeostasis model assessmentestimated insulin resistance; TyG, triglyceride and glucose; AST, aspartate aminotransferase; ALT, alanine aminotransferase; WBC, white blood cell.

* This value represents the odds ratio.

Appendix 2.

Comparison between AE and RE groups, before matching

Variable AE only group RE only group
Coefficient (95% CI) P-value
Body mass index (kg/m2) Ref -1.027 (-2.355 to 0.302) 0.129
Waist circumference (cm) Ref -2.263 (-5.723 to 1.196) 0.198
Mean blood pressure (mm Hg) Ref -1.777 (-3.951 to 0.396) 0.108
Cholesterol (mg/dL) Ref -10.369 (-18.628 to -2.110) 0.014
Triglyceride (mg/dL) Ref -16.895 (-30.309 to -3.482) 0.014
High-density lipoprotein cholesterol (mg/dL) Ref 1.152 (-1.465 to 3.769) 0.386
Low-density lipoprotein cholesterol (mg/dL) Ref -8.222 (-15.711 to -0.733) 0.032
Glucose (mg/dL) Ref -1.343 (-3.482 to 0.795) 0.217
Insulin (IU/L) Ref -2.889 (-6.475 to 0.697) 0.114
Homeostasis model assessment-estimated insulin resistance Ref -0.760 (-1.650 to 0.129) 0.093
Hemoglobin A1c (%) Ref 0.030 (-0.046 to 0.107) 0.432
Triglyceride and glucose index Ref -0.158 (-0.313 to -0.002) 0.046
Aspartate aminotransferase (IU/L) Ref -0.277 (-3.295 to 2.742) 0.857
Alanine aminotransferase (IU/L) Ref -0.376 (-6.626 to 5.874) 0.906
White blood cell (thousand/μL) Ref -0.305 (-0.773 to 0.162) 0.199
Metabolic syndrome (yes) Ref 0.197* (0.025 to 1.058) 0.075

AE, aerobic exercise; RE, resistance exercise; CI, confidence interval; Ref, reference.

* This value represents the odds ratio.


ABOUT
ARTICLE CATEGORY

Browse all articles >

BROWSE ARTICLES
INFORMATION FOR AUTHORS AND REVIEWERS
Editorial Office
Room 2003, Gwanghwamun Officia, 92 Saemunan-ro, Jongno-gu, Seoul 03186, Korea
Tel: +82-2-3210-1537    Tax: +82-2-3210-1538    E-mail: kjfm@kafm.or.kr                

Copyright © 2024 by Korean Academy of Family Medicine.

Developed in M2PI

Close layer
prev next