INTRODUCTION
The prevalence of hypertension among Korean adults is 26.9% according to the 2010 Korean National Health and Nutrition Examination Survey (KNHNES), and it is a very common chronic disease. However, it is a major risk factor for cardiovascular diseases such as coronary artery disease, cardiac failure, and stroke.1) Its pathophysiologic mechanisms are associated with both genetic and environmental factors. Thus, this disease is of a complex and multifactorial origin.2) Over the past several decades, the following genetic and environmental factors have been described as risk factors for hypertension: age, a family history of hypertension, obesity, exercise, salt intake, smoking, years of education, and hormone depletion.2,3,4) Particularly, female hormones affect the degree of tension in vascular endothelial cells and blood vessels. Female hormones affect the cardiovascular system, particularly, blood pressure.4,5) Menopause associated with alterations in hormone levels, oral contraceptives, and endocrine therapy have been reported as risk factors for hypertension in women.6,7,8) However, studies pertaining to the correlation of factors that greatly affect physiological changes in the female menstrual cycle, such as pregnancy, delivery, and breast feeding, with hypertension are limited. In particular, pregnancy remarkably alters the cardiovascular system in women. During pregnancy, women show an increased cardiac output and perfusion and improved functions of the systemic vascular endothelial cells. Thus, these findings indicate hemodynamic adaptation that lowers vascular resistance. This adaptation not only exerts a short-term effect on the cardiovascular system but also exerts a potential long-term effect on postpartum outcomes.9,10,11,12) However, the correlation between parity and hypertension remains a topic of debate according to epidemiological studies conducted thus far. Given the above background, this study was conducted to determine the correlation between parity and hypertension among Korean women on the basis of the KNHNES data.
METHODS
1. Study Population
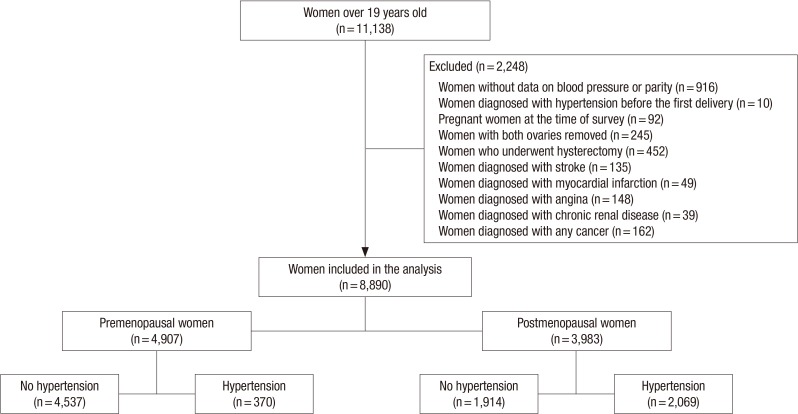
The current study enrolled women aged ≥19 years who participated in the fifth KNHNES for hypertension measurement in the first, second, and third year (2010-2012). Figure 1 presents the selection criteria of the study population. We excluded women who were diagnosed with hypertension before the first delivery or underwent bilateral oophorectomy or hysterectomy; pregnant women; and women with malignancy, stroke, myocardial infarction, angina pectoris, or renal failure. Finally, we enrolled, in total, 8,890 women in the current study.
2. Definition of Parity
Parity is defined as the number of times a female has given birth counting multiple births as one.13) In the current study, we calculated the sum of spontaneous deliveries and the frequency of cesarean sections on the basis of a questionnaire survey.
3. Definition of Hypertension
Hypertension was defined as hypertension diagnosed by a physician, the current use of antihypertensive drugs, or a final systolic blood pressure (SBP) of >140 mm Hg or a final diastolic blood pressure (DBP) of >90 mm Hg.
4. Measurement of Blood Pressure
According to the KNHNES, blood pressure was measured using a standard sphygmomanometer at rest for more than 10 minutes; it was measured at the upper arm 3 times at a 5-minute interval. Blood pressure was also measured in the second and third blood pressure monitoring sessions, and the average of the measurements was taken as the final SBP and DBP.
5. Definition of Natural Menopause
Natural menopause was defined as the lack of menstruation for consecutive 12 months without physiological or pathological causes.1) During menopause , hormon levels alter dramatically. so menopause affect blood pressure greatly.4,5) Accordingly, in the current study, women who responded that they experienced natural menopause to a questionnaire survey were classified into the group of women who achieved natural menopause. On the basis of these criteria, our subjects were classified into the premenopausal group and the postmenopausal group.
6. Application of the Korean National Health and Nutrition Examination Survey Data
The following items were evaluated through an interview: parity, a family history of hypertension, a past history of treatment with antihypertensive drugs, a past history of treatment with oral contraceptives, a past history of estrogen therapy, and a past history of menopause. In addition, a past history of smoking and drinking and the pattern of exercise were evaluated through a self-administered questionnaire study. Regarding the nutritional status, the daily sodium intake was evaluated through measurement of the types and the amount of ingested food 1 day before the current study through a 24-hour recall. Thus, we calculated the sum of the daily sodium intake from the diet of the subjects over a 1-day period. Although we determined the sodium intake 1 day before the current study, we presumed that the intake might not differ from their daily intake. Therefore, sodium intake was considered a variable in the current study. Regarding the smoking status, the subjects were classified into current smokers, past smokers, and non-smokers. Subjects were regarded as drinkers if they consumed alcohol more than once a month, and they were regarded as non-drinkers if they consumed alcohol less than once a month. The pattern of exercise was evaluated using the International Physical Activity Questionnaire. The group of subjects who performed regular exercise comprised those who performed a single session of vigorous physical activity for >20 minutes for >3 times a week or those who performed a single session of a moderate-level physical activity for >30 minutes for >5 days a week. The total amount of household income was adjusted using the number of households, and the subjects were classified into the following 4 groups: inferior, middle inferior, middle superior, and superior. In terms of the years of education, the subjects were classified into the following groups: <9 years, 9-12 years, 12-16 years, and >16 years. Subjects were considered to be on contraceptive and estrogen medication if they were administered these therapies more than once a month. Physical measurements were recorded using a mobile health check-up system. The height and weight were measured in units of 0.1 cm and 0.1 kg, respectively. The body mass index (BMI) was calculated using the formula: (weight in kg)/(height in m2).
7. Statistical Analysis
The postmenopausal period is characterized by remarkable alterations in the blood pressure due to alterations in the endocrine system.8) All the analyses were performed by classification of the subjects into the premenopausal group and the postmenopausal group. To analyze the baseline and general characteristics of the subjects, we expressed continuous variables as mean±standard error (SE) by using the independent sample t-test. Categorical variables were expressed as frequency (percentage, %) using the χ2 test. In addition, regarding the correlation between parity and hypertension, the premenopausal group was compared with the postmenopausal group by using a multiple regression analysis. To avoid the effect of the use of antihypertensive drugs on the results of the multiple regression analysis, we performed the analyses by using tables that included data of subjects with a past history of antihypertensive medication and tables that excluded data of such subjects. At the time, the statistical significance was tested using the following 4 models: (1) a model where only the age was adjusted according to the adjusted variables (model 1); (2) a model where the age, diabetes, dyslipidemia, BMI, a family history of hypertension, and a past history of antihypertensive medication were adjusted (model 2); (3) a model where smoking, drinking, exercise, daily sodium intake, a past history of oral contraceptive therapy, a past history of estrogen therapy, and the age of menarche were adjusted in model 2 (model 3); and (4) a model where years of education and the level of income were adjusted in model 3 (model 4). Moreover, to identify a correlation between parity and hypertension, we calculated the odds ratio (OR) and 95% confidence intervals (CI) by using a logistic regression analysis. For the logistic regression analysis, we used the same 4 abovementioned models that we used for the multiple regression analysis. Statistical analysis was performed using the IBM SPSS ver. 19.0 (IBM Co., Armonk, NY, USA). A P-value of <0.05 was considered statistically significant.
RESULTS
1. General Characteristics of the Study Subjects Who Were Classified according to the Hypertension and Menopause Status
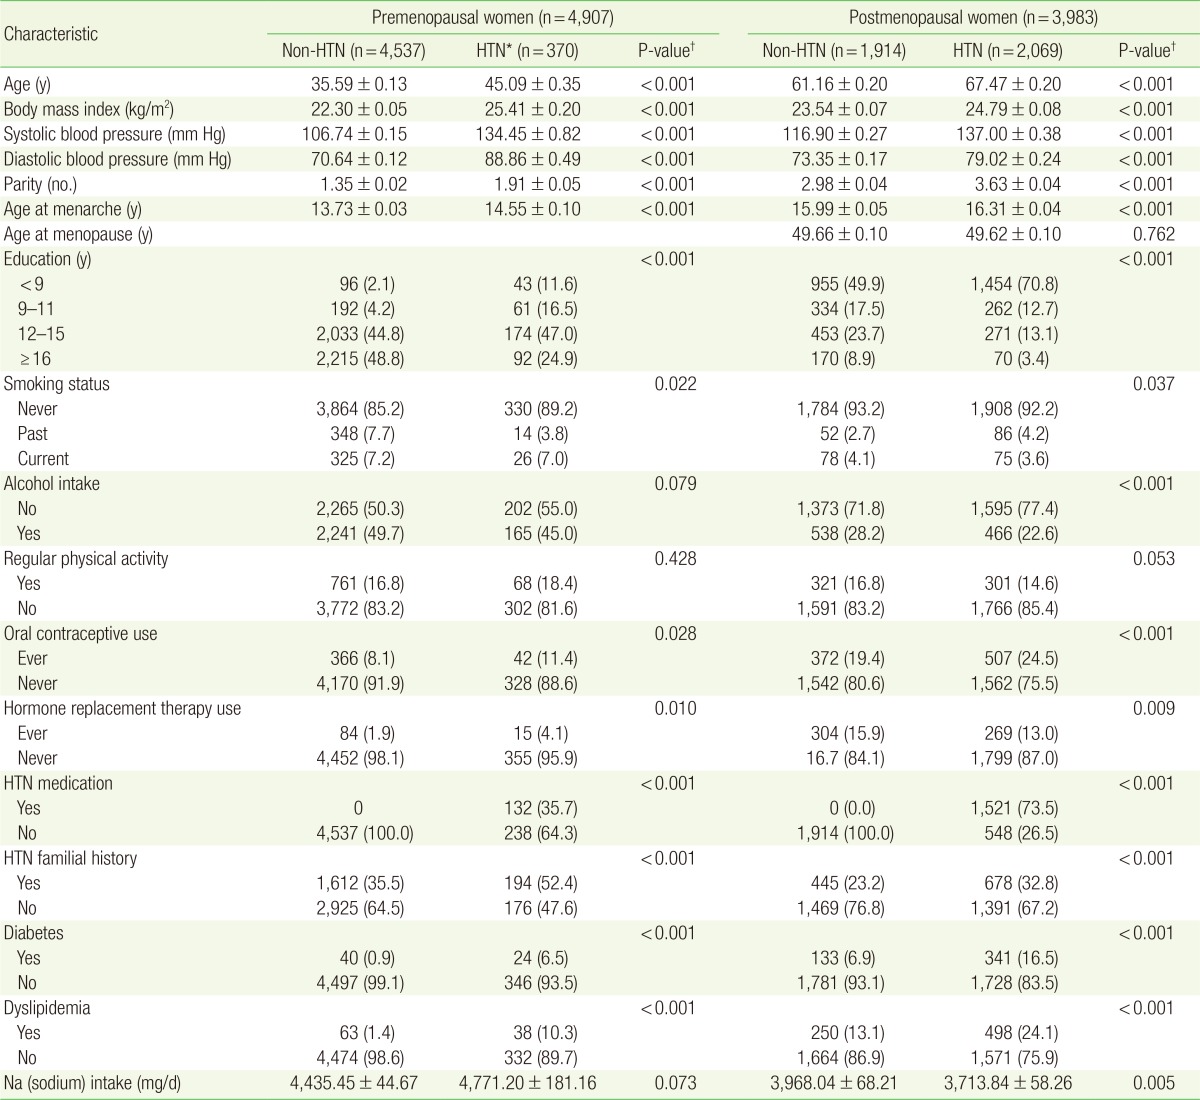
As shown in Table 1, this study included 4,907 premenopausal women and 3,983 postmenopausal women. The premenopausal women comprised 4,537 (92.5%) non-hypertensive women and 370 (7.5%) hypertensive women. The mean±SE age of the non-hypertensive and hypertensive premenopausal women was 35.59±0.13 years and 45.09±0.35 years, respectively (P<0.001). The group of postmenopausal women comprised 1,914 (48.1%) non-hypertensive women and 2,069 (51.9%) hypertensive women. The mean±SE age of the non-hypertensive and hypertensive postmenopausal women was 61.16±0.20 years and 67.47±0.20 years, respectively (P<0.001). The non-hypertensive premenopausal women significantly differed from the hypertensive premenopausal women in terms of the following variables: mean BMI (P<0.001), parity (P<0.001), mean age at menarche (P<0.001), years of education (P<0.001), a past history of oral contraceptive therapy (P=0.028), a past history of estrogen therapy (P=0.010), a family history of hypertension (P<0.001), a diagnosis of diabetes (P<0.001), and a diagnosis of dyslipidemia (P<0.001). The non-hypertensive postmenopausal women significantly differed from the hypertensive postmenopausal women in terms of the following variables: mean BMI (P<0.001), parity (P<0.001), mean age at menarche (P<0.001), years of education (P<0.001), a past history of oral contraceptive therapy (P=0.028), a past history of estrogen therapy (P=0.009), a family history of hypertension (P<0.001), a diagnosis of diabetes (P<0.001), and a diagnosis of dyslipidemia (P<0.001).
2. Correlation between Parity and Blood Pressure Determined Using the Multiple Regression Analysis
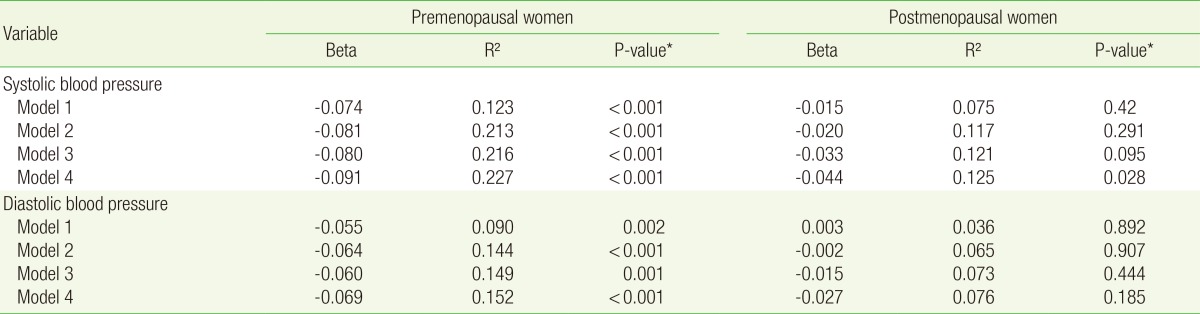
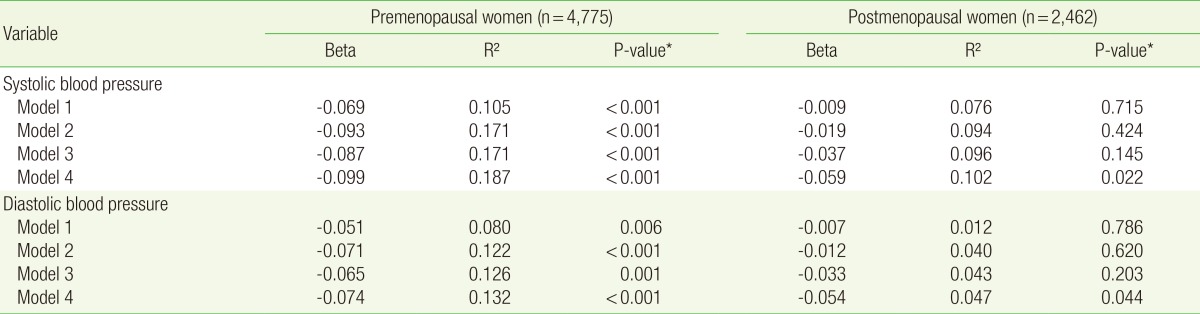
Tables 2 and 3 show the correlation between parity and blood pressure. As shown in Table 2, analysis of the data of the premenopausal women, under all the models (models 1, 2, 3, and 4), showed an inverse correlation between parity and SBP (β=-0.074 [P<0.001]), β=-0.081 [P<0.001], β=-0.080 [P<0.001], and β=-0.091 [P<0.001], respectively) and between parity and DBP (β=-0.055 [P=0.002], β=-0.064 [P<0.001], β=-0.060 [P=0.001], and β=-0.069 [P<0.001], respectively). Analysis of the data of the postmenopausal women, under model 1-3, showed no statistically significant correlation between parity and hypertension (P>0.05). In model 4, however, an inverse correlation was observed between parity and SBP (β=-0.044 [P=0.028]). In the postmenopausal women, however, no significant correlation was observed between parity and DBP. As shown in Table 3, analysis of the data of the premenopausal women, under all the models (models 1, 2, 3, and 4), showed that parity was inversely correlated with both SBP and DBP. Analysis of the data of postmenopuasal women showed that parity was inversly correlated with SBP and DBP in model 4 only (β=-0.059 [P=0.022] and β=-0.054 [P=0.044], respectively).
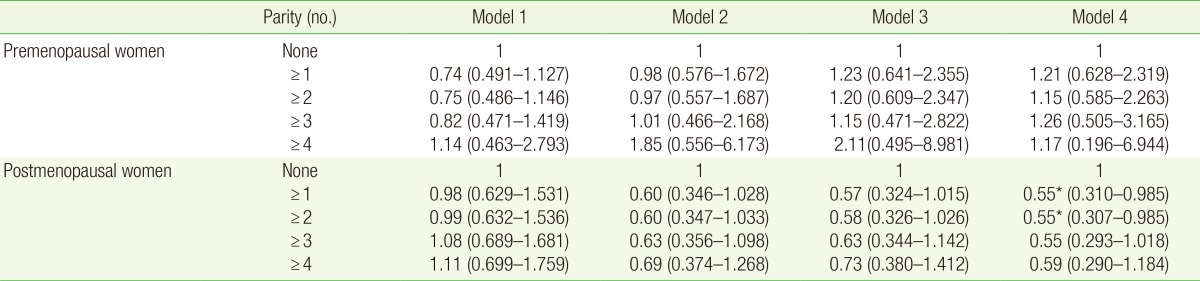
3. Correlation between Parity and the Prevalence of Hypertension as Determined Using the Logistic Regression Analysis
Table 4 presents the correlation between parity and the prevalence of hypertension. Among postmenopausal women with >1 deliveries and 2> deliveries, as compared with nonparous women, according to model 4, the OR was 0.55 (95% CI, 0.310-0.985; P=0.044) and OR was 0.55 [95% CI, 0.307-0.985]; P=0.045). This finding suggests that the prevalence of hypertension was significantly lower, by approximately 45%, among postmenopausal women with >1 deliveries and >2 delivaries than among nonparous women. Among postmenopausal women with a past history of >3 deliveries, as compared with nonparous women, the OR was 0.55 (95% CI, 0.293-1.018; P=0.057).
DISCUSSION
In the current study, after adjustment for the various variables known to have a correlation with hypertension, we analyzed the correlation between parity and hypertension. Our results showed that in both premenopausal women and postmenopausal women, parity was inversely correlated with both SBP and DBP. In addition, analysis of the correlation between parity and prevalence of hypertension showed that parity decreased the prevalence of hypertension in postmenopausal women by approximately 45% after adjustment for all the variables.
According to the analysis in which the data of patients with a past history of antihypertensive therapy were excluded, parity showed a significant inverse correlation with both SBP and DBP in postmenopausal women, after adjustment for all the variables, including age. Thus, we speculated that because highly complex factors are involved in the pathophysiological mechanisms of hypertension in postmenopausal women, identification of a correlation between parity and blood pressure would be possible, provided confounding variables are adjusted to the maximum possible extent.
In this study, besides the multiple regression analysis for the correlation between parity and blood pressure, we attempted to analyze the mean blood pressure depending on the frequency of delivery. According to a comparison of the mean values depending on parity without adjustment for age and other confounding variables, results contradictory to the results of the multiple regression analysis were obtained. However, analysis of the correlation between parity and mean values of blood pressure without apptropriate adjustment would be meaningless, because accurate measurements of parity and blood pressure would not be possible without adjustment. Therefore, although the multiple regression analysis, wherein the age and other confounding variables were adjusted, yielded low β-values, we assume that the current study provides a basis for further various in-depth studies on this topic. Thus, the clinical significance of the current analysis would be sufficient.
According to the logistic analysis under model 4, the prevalence of hypertension was significantly lower in postmenopausal women with a history of >1 deliveries than in nonparous postmenopausal women. However, the prevalence of hypertension did not differ significantly between postmenopausal women with a history of >3 deliveries and nonparous postmenopausal women. This observation deserves further study.
According to overseas reports about the correlation between parity and blood pressure, various conclusions have been proposed. As maternal protection conferred by delivery, an inverse correlation between parity and the prevalence of hypertension has been previously reported.14,15) According to similar series studies performed on this topic, as parity increased, the blood pressure decreased up to 20 years after delivery.9) In addition, improved functions of vascular endothelial cells were maintained even after delivery, according to some reports.16,17) By contrast, the absence of a significant correlation between parity and blood pressure has also been reported.10,18) Moreover, other controversial opinions such as the presence of a correlation between parity and the risk for hypertension have been proposed. 19,20,21) The inconsistency among the previous observations might arise from the study design, number of enrolled patients, and adjustment for confounding variables.15) In particular, according to many studies, the key risk factors for hypertension in women, such as age, menopause, and BMI, serve as the greatest confounding variables.15)
Pregnancy causes maternal hemodynamic derangements. With the maintenance of pregnancy, an increase in the amount of maternal perfusion, cardiac output, and pulse pressure would be observed. Moreover, a decrease in perfusion pressure and systemic vascular resistance, eventually followed by increased perfusion to the uterine placenta without impairments in maternal blood flow, would be observed. In the first trimester of pregnancy, the mean arterial pressure decreases. The reason for this decrease might be a decrease in the response of the systemic vessels to norepinephrine and angiotensin II along with the activity of nitrate oxide.22,23,24) Angiogenic factors (vascular endothelial growth factor and placental growth factor), synthesized by placental trophoblasts, serve as mediators of growth of placental and uterine arteries, and thereby lower peripheral vascular resistance of the mother.25) These alterations correspond to abrupt changes in the maternal hemodynamic profile during pregnancy. Little is known about physiological mechanisms underlying the physiological adaptation of the mother after the completion of the pregnancy. The hypothesis is that the increased blood flow during pregnancy is correlated to the repeated adaptation of blood vessels.14) Further studies are required to elucidate the long-term effects of delivery on blood pressure.
The current study has several limitations as follows. (1) The current study was a cross-sectional one. The temporal relationship between parity and changes in blood pressure could not be clarified. Therefore, the causal relationship between the 2 variables could not be determined. (2) Because of the insufficient amount of data, we failed to consider gestational hypertension,26) a cardiovascular disease that may affect hypertension. (3) The amount of sodium intake was recorded through a 24-hour recall, and this amount was considered as the daily sodium intake.
Nevertheless, the current study would be of clinical significance according to the following points: (1) To our knowledge, no study about the correlation between parity and blood pressure has been performed in Korea. Using the KNHNES data that are both representative of the Korean population and highly reliable, we analyzed the correlation between parity and blood pressure after adjustment for age and BMI, which served as confounding variables, depending on the presence of menopause. (2) Through the collection of the data on risk factors associated with blood pressure, the current study presented from model 1 to model 4 with adjustment for different variables.
In conclusion, the current study showed that parity was inversely correlated to both SBP and DBP in premenopausal and postmenopausal Korean women. Moreover, it showed that the prevalence of hypertension was significantly lower in postmenopausal parous women than in nonparous women. Further studies will be conducted to examine the temporal relationship between parity and alterations in blood pressure as well as to identify the underlying physiological mechanisms.